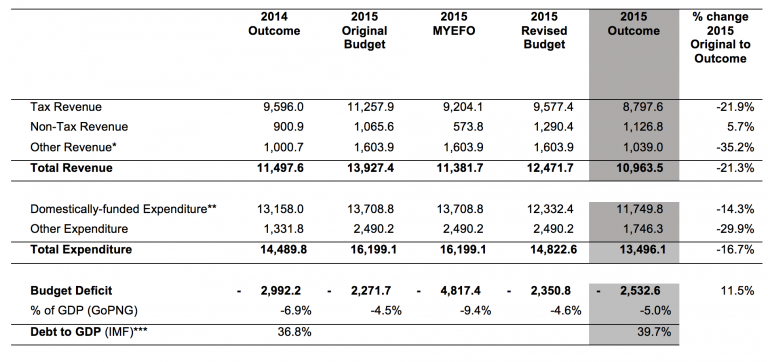
Last Thursday, PNG Treasury released an update on what may really have happened with the 2015 budget. Like the mid-year TreasuryMYEFO update, this is a frightening document that points to a collapse in government revenues of 20 per cent in 2015 relative to the budget, and reveals 2015 expenditure reductions of 37% in health, 36% in infrastructure and 30% in education, areas the government said would be protected. The combined budget deficits over the last three years of 24% of GDP are the largest for a three year period in PNG’s history.
The Final Budget Outcome (FBO) is one of four key budget documents each year and must be released by 31 March. The 2015 FBO is a comprehensive document that fills in many of the gaps of the 2016 Budget, including finally providing detail on where cuts were made in the Supplementary Budget. Key aggregates are shown below.
Table 1: Fiscal aggregates from the 2015 Final Budget Outcome (FBO)
 Note: These figures are based on the 1986 Government Finance Statistics reporting arrangements.
* Other includes donor grants, Input Tax Credits, concessional loan expenditure and trust account “savings”.
** This excludes expenditures financed by donor grants and official loans.
*** Uses IMF GDP figures, where deficit/GDP figures use GoPNG GDP numbers.
Revenue
The government acted in the 2015 Supplementary Budget to try and shore-up the 20 per cent collapse in revenue predicted in the MYEFO. However, it had limited success, with tax revenue falling K2,460 million in 2015, around K400 million more than expected at the time of the MYEFO. The outcome is nearly 10 per cent lower than in 2014, despite the great pressure placed on the tax and customs departments to increase collections. As tax revenue is strongly correlated to the underlying health of the PNG economy, the continuing fall in revenues outside as well as within the resource sector is a concern.
Non-tax revenues fared better, but at risk to other policy objectives. With the failure to sell the shares in NPCP (the company which carries PNG’s interest in the PNG LNG project) for the K2,500 million originally included in the 2015 budget, pressure was placed on State Owned Enterprises (SOEs) to increase payments to government. This occurred, with payments from SOEs and Statutory Authorities other than NPCP totalling K455 million relative to a budget estimate of K80 million (with a further K100 million in dividend payments actually made in January 2016).
Given the poor performance of most of PNG’s SOEs, the availability of such funds is surprising. However, looking at bank data, it appears that these SOEs have been able to make major borrowings from the domestic banks (at least from the Bank of the South Pacific). This cycling of funds through SOEs, if that is what it is, may be a clever financing technique to avoid prudential limits on direct exposure to government bonds, but doing so could entail significant risks, including for the health of PNG’s financial system. There is also another dividend payment of K451.4 million from the National Petroleum Company. The source of funding for this payment is not clear (it appears well beyond any PNG LNG dividends). Altogether, SOE 2015 dividend payments total one billion Kina – an extraordinary outcome.
The FBO also suggests a major fall in donor grants of 40%, but this may mainly reflect late reporting by some donors, and any changes would affect expenditure and revenue equally.
Expenditure
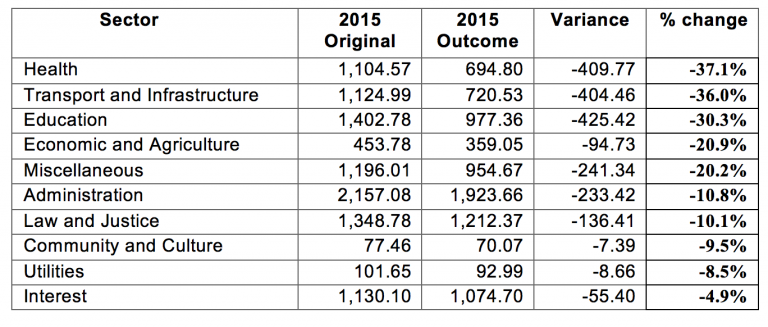
In the 2016 Budget, the government acted to reduce expenditures in line with falling revenue projections. As arguedelsewhere, this adjustment was too late. The 2015 FBO reveals that overall domestic expenditure reductions in 2015 amounted to 14.3%. However, the cuts in particular sectors are particularly worrying. The largest cuts were to health – an extraordinary within year cut of 37.1%. Infrastructure was cut by 36.0%, and Education by 30.3%. This pattern of cuts is the opposite of what the government claims are its priorities and the areas that would be protected. These are frightening figures for service delivery in PNG, as well as investment in human resources.
Table 2: Comparison of 2015 budgeted and final sectoral expenditure figures for 2015 (K million)
Note: Based on Table 18 in the 2015 FBO.
In amongst all of these cutbacks, public service wage payments have escaped the pain. Despite attempts to trim these, the final outcome was K3,934 million – right in line with the original budget, and considerably higher than the 2014 outcome of K3,697 million.
A possible upside is that the cuts may not be as severe as shown in the table. This is because the Final Budget Outcome is in fact not ‘final’. As noted in the report, “The reduction in actual expenditure relative to the Revised Budget stems from a significant float of 2015 expenditure into 2016 that was not captured at the time of writing this report.” This pattern of “floating” expenditure is probably spread rather evenly across all sectors, so there remains a very worrying gap between stated and actual sectoral priorities. Moreover, we know a large number of cheques were cancelled in early 2016, so it is unclear how much expenditure did in the end “float” across to 2016.
Macroeconomic analysis
The 2015 FBO reflects the government’s major economic challenges flowing from its earlier expenditure build-up, the collapse in revenues that go well beyond resource revenues, the massive cuts in expenditure that will flow through to lower demand in the economy, and the difficulties of financing the deficits. The documents flips back to a 1986 accounting system rather than the 2014 system used in the 2016 budget. The ‘1986 system’ showed the deficit in 2014 as 6.9% of GDP, while the new system showed it as 8.3%, 1.4 percentage points higher. The 2015 deficit is reported as being 5.0% of GDP, up from the 4.5% level originally expected. However, as argued here, the GDP figures used in PNG Treasury documents include miscalculations on LNG prices and are overstated, according to the IMF, by over 10%. Using the IMF estimated figure for 2015 GDP of K45.3 billion, the revised deficit is 5.6% of GDP, as per the old standards, and based on the 2014 experience, possibly higher using the newer standards.
The combined deficits from 2013 to 2015 now total 23.6% of GDP (using GDP from the IMF as the base and the new GFS figures for 2013 and 2014). The previous largest three year run of deficits was 16.1% from 1991 to 1993. This is therefore the largest run of deficit figures in PNG’s history by far.
The financing challenge is also reflected in the new debt to GDP ratio. The PNG Treasury document shows the debt to GDP ratio at 35.2%, just above the legislative limit of 35%. Using the IMF GDP figures, the ratio is 39.7% of GDP. This does not include other government liabilities, such as for unmet superannuation obligations.
Conclusion
The fall in international commodity prices was outside of PNG’s control. However, spending so much up-front in anticipation of higher PNG LNG was a risky and, in the end, irresponsible strategy. The pattern of expenditure reductions in 2015 suggest that not enough is being done to protect priority sectors. Especially with the likelihood that there will be no sovereign bond, the FBO, and the collapse in revenue that it confirms, add to the arguments that PNG is in a fiscal cash crisis. PNG should be reaching out to friends for assistance, accepting that this will involve some conditions for getting the house back into order.

