PNG’s Post Courier on 4 June carried an article indicating the Prime Minister considered the PNG economy could reach K100 billion by 2018.
Hopefully, this was mis-reporting. As an accountant, one would hope that the Prime Minister of PNG would understand numbers well enough to know that there is no prospect at all of GDP reaching this figure by 2018, or even 2020. Stating otherwise would be deceptive and massively contrary to all previous official estimates from his government and the IMF. One would be reminded of the problems created for Greece with their use of fake statistics.
Official statistics
So how does this claim of K100 billion compare to other official estimates?
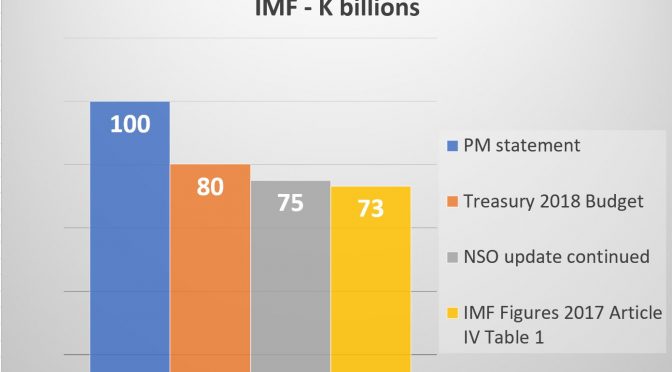
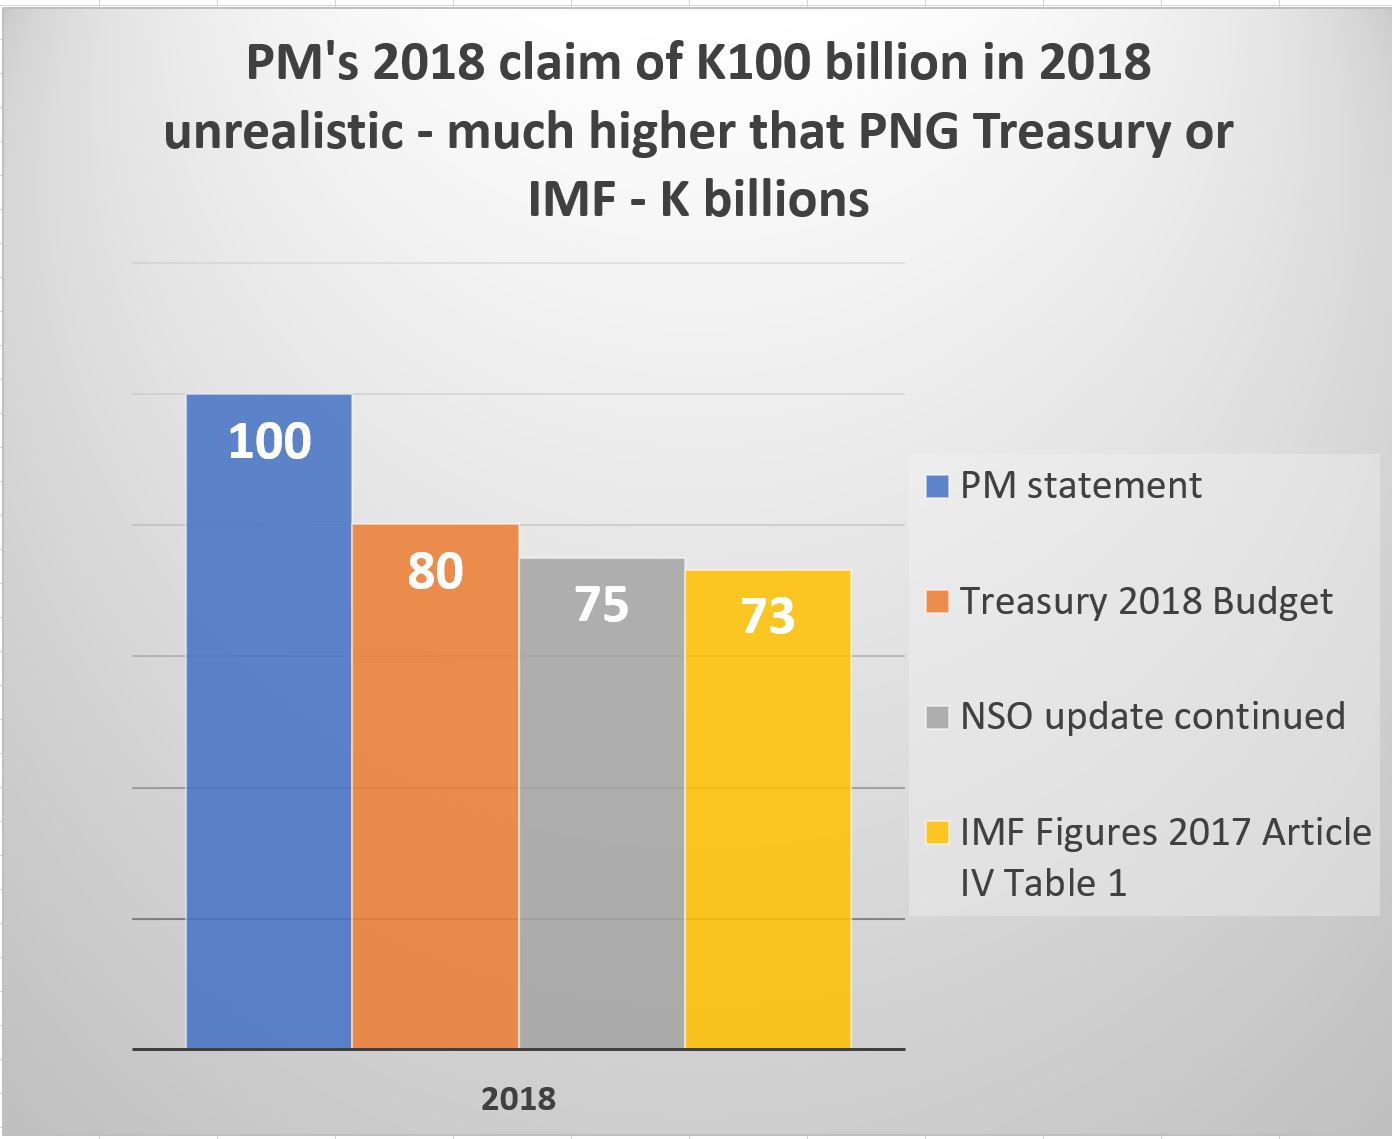
The PNG Treasury in its 2018 Budget statements indicated its estimate for the economy in 2018 was K80 billion (Table 1 of Appendix 3 of Statement 1). Unfortunately, this figure was estimated before PNG’s National Statistical Office down-graded the size of PNG’s economy by K5.1 billion in 2015 (bulletin of 9 March 2018). Such a reduction is likely to flow through into future year figures also – so the PNG Treasury/NSO number is more likely to be around K75 billion in 2018. The IMF’s estimate for 2018 is still slightly lower at K73 billion. None of these figures have included the latest very worrying economic figures from the Bank of PNG – a fall in employment, retail sales and negative growth in private sector investment which suggest a distinct possibility that PNG returned to a recession in 2017 – see here. A comparison between the various numbers is shown in the following graph:
Is the economy doing well?
The article also suggested that the Prime Minister considered such a high GDP figure indicates that the economy is doing very well. Only naysayers would be disagreeing.
Unfortunately, apart from the 2018 GDP reality being at least 20% lower than the figure quoted for the Prime Minister, economists consider issues other than just the nominal size of GDP when thinking about how an economy is going.
Nominal GDP is a very poor indicator of economic welfare, especially in a country such as PNG where the resource sector is largely foreign owned. There is also a need to take into account changes in prices – prices are expected to increase by 56% over the decade, meaning less spending power for every Kina. Every year, there are also more mouths to feed – an additional 250,000 per year according to the NSO.
Putting these other elements together means a better way to judge how the economy has gone since, say 2010, is to look at real per capita elements of GDP as done in the following graph:
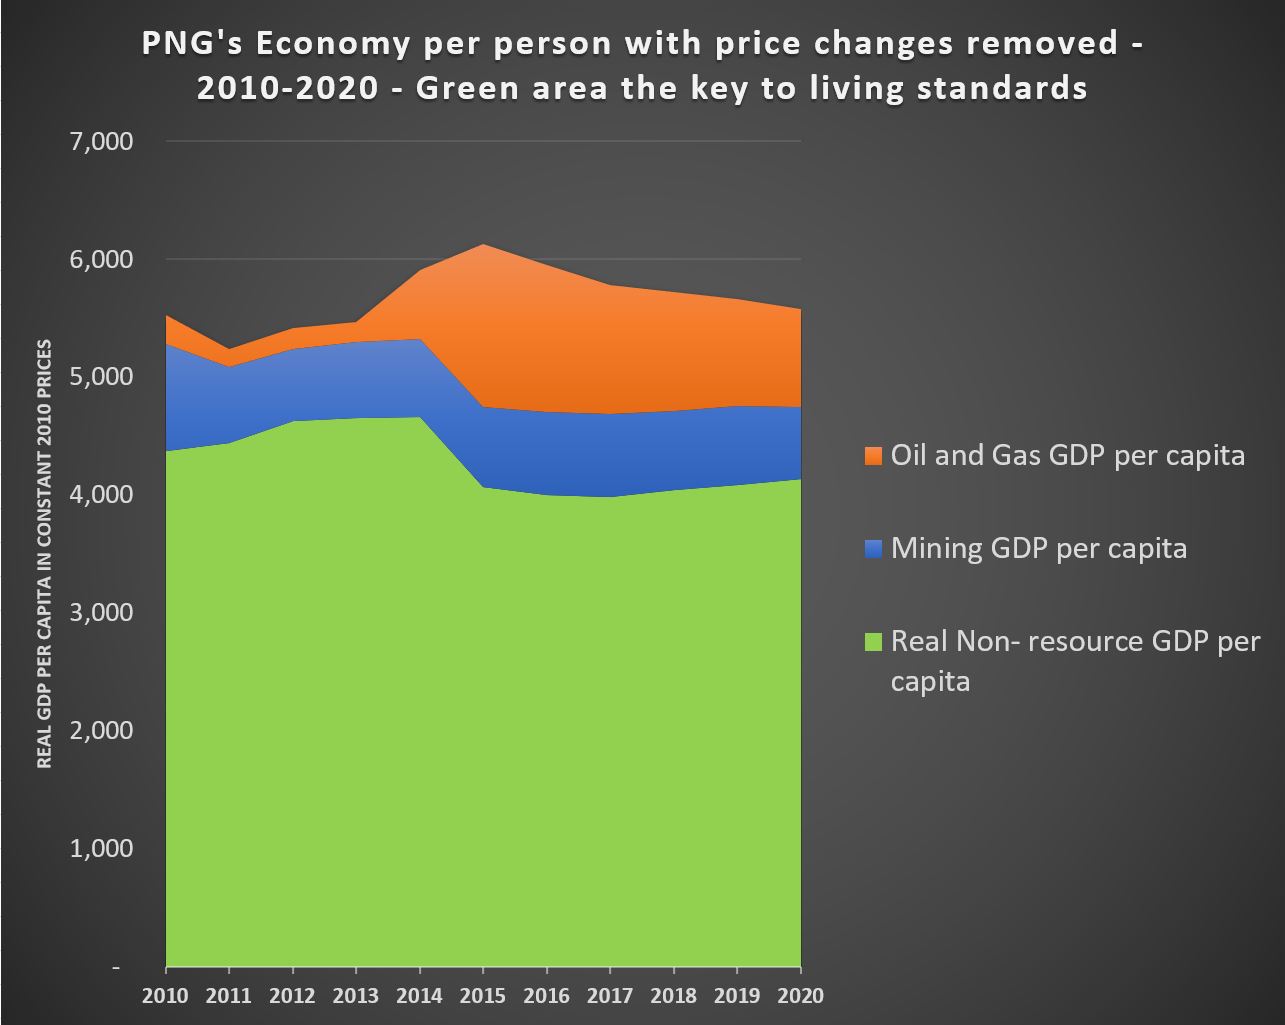
The green area is the best reflection of actual movements in living standards over the 2010s. It represents non-resource GDP, so it picks up the agriculture sector, construction, trade, utilities, services and government. Note that it is by far the largest part of the economy – averaging some 84% of the economy since Independence. The decade started well, assisted by the construction phase of the PNG LNG project, with positive increases in non-resource GDP per capita totaling 7%. With the 2015 recession, these have quickly dropped away. Current growth projections of 3.5% in the non-resource economy, slightly above population growth rates, means that the Treasury is predicting very small improvements in the few years up to 2020. But in recent years, PNG Treasury’s growth forecasts have been excessively optimistic – so this improvement is just a forecast.
The blue shaded area indicates the contribution from the mining sector. It has stayed fairly stable over the decade. The orange shaded area represents the impact of the PNG LNG project, especially the massive increases in 2014 and 2015. However, the benefits of this have largely gone overseas to date (there was more capture of benefits during the construction phase).
Altogether, the graph represents movements in total GPD per capita. So between 2010 and 2020, there has been an increase of 6% in total real GDP per capita – or 0.6% per year. Not very much, and all that driven by the PNG LNG sector. On the other hand, the real measure of economic welfare for the people of PNG has gone backwards by 5%, so negative 0.5% each year.
Conclusion
It is very positive that the Prime Minister attended the launch of a strategy for the development of statistics in PNG. PNG has suffered from a lack of good statistics. For instance, in the latest APEC regional economic report, PNG is mentioned nine times. Unfortunately, on seven of those times, it was simply to note that PNG did not have the relevant statistics available.
One must not only collect numbers, one must understand them. Looking at PNG’s limited economic statistics over recent years are not at all encouraging. Saying there are very clearly severe problems and poor outcomes is simply being realistic – it is not being a naysayer. PNG’s two international credit ratings agencies have had a look at these available statistics and their response was an unprecedented down-grade by both within a month of PNG’s credit rating. Reported claims by the PNG Prime Minister that the economy is doing well and could reach K100 billion in 2018 simply undermines PNG’s economic credibility and damages the chances of securing an international sovereign bond.