All posts by pngeco5_wp

1. Technical errors and convenient political claims – Employment

Executive Summary

The 2019 Budget is scattered with factual errors. This note covers employment.

The 2019 Budget claims total employment grew by 1.6 per cent in the last year. In fact, it declined by 2.9%. This significant error was repeated in double page ads promoting the government’s economic performance, with a graph showing employment increasing strongly from 2014. The fact check indicates that total employment has fallen by 6.6% since 2014.

So why do the graphs in national papers and in the budget itself show employment has been increasing since 2014?

Absolute technical incompetence in understanding the difference between an index of numbers and the numbers themselves is probably the most likely answer. However, as there is a pattern of these convenient statistical mistakes, possibly there is a more Orwellian pattern emerging in the details of PNG budgets?

Details

The following information was included in double page ads taken out by the Government on 20 November promoting the 2019 Budget in both national dailies – conveniently on the day the Opposition was providing its budget response. Over coming days, I will provide some analysis of all the points made over the double page spread.

The graph already had confused myself and other researchers familiar with trends in employment in PNG. It first appeared as Chart 16 on page 32 of the 2019 Budget. It was one of those PNG budget anomalies that one let’s go through to the keeper. (For some unusual reason, a phenomena repeated across many countries I understand, not many people actually read the detailed budget documents?!). However, when the graph was highlighted in a double page add by the government to a much wider audience in PNG, it needed closer examination, especially when the heading for the graph was the misleading “The trend for employment growth is positive”. And even more so when it is set directly next to an upbeat message from the Treasurer – how can one “fix lingering issues from our past” if that past is being mis-represented? “Building a broader economic base” risks building on some pretty unsteady foundations if the employment situation is so badly misunderstood.

The underlying source for the graph is Table 9.7 of the Quarterly Statistical Bulletin available on the BPNG website. This provides quarterly changes in the index – annual figures are available from page 172 in Table 7 Annex 3 Volume 1 of the 2019 Budget Papers. The graph below shows those indexes from June 2010 (to match the starting point shown in the ads). The bottom blue line is the index for the non-resource sectors, the red line indicates the resource sector. Clearly, looking at the graph, the non-resource sectors of the economy had been declining since 2014 in what looks like a rather flat blue hill. On the other hand, the resource sector had gone through a steep climb and then descent, before a strong recovery, so it looks more like a red mountain.

Then I did something really stupid – just checking – I know that you just don’t add indexes together without checking their respective weights. You’re taught this in basic statistics. However, when doing the crazy thing of adding these indexes together – so giving them equal weights – I ended up with the green line (called “Government Botched”). And the green line is exactly the same as what appears in the 2019 Budget as well as the newspaper ads spruiking the budget. And to confirm this absurdity, it did indeed produce a “total” employment growth rate of 1.6%.

Why is this stupid? One index was based on 351,721 jobs in 2011, the other index was based on 9,011 jobs. By simply adding the two indexes together, you ignore that one index is 40 times more influential in determining total formal employment trends. Is this just technical incompetence? Or a search for a convenient political number pretending there was employment growth in the economy?

So what is the actual situation? Not surprisingly, given that the blue index line for the non-resource sector represents 40 times as many jobs as the red line, the overall trend closely follows the blue line. The following graph converts the indexes to actual numbers using the 2011 Census estimate of 360,000 formal sector jobs. Actual non-resource estimates are shown by the blue column, and the resource sector is shown by the red bit on the top. The data is extended back to prior years to give a longer perspective.

This is such a different story that the newspaper line “The trend for employment growth is positive”. This claim only results from a massive statistical error and misunderstanding of indexes. The actual employment trend since 2014 has been very poor. Since 2014, there has been an encouraging increase in formal resource sector employment of 2,787. However, non-resource employment has dropped by over ten times this amount with a loss of 28,676 jobs, leading to an overall fall of 6.6% in formal employment. The figure should have shown an increase of over 40,000 new jobs just to keep up with population growth.

Indeed, these on-going falls in formal employment is one indicator that the PNG economy is very sick – much sicker than being admitted by the government. And on that issue, I’ll do another blog covering similar technical errors in the 2019 Budget and its GDP figures – including another extraordinary statistical incompetence story of why the PNG government is not using its own National Statistics Office figures.

Even more technical details

An index converts actual figures back to a common reference point. In the case of BPNG, the reference point is set as 2002 = 100. The index then shows percentage changes from this index point. If one wants to combine different index series, one needs to determine a weight (or the share of the total) to apply to each index before adding them together. This is also usually determined from the base year. So what is called in the ‘non-resource’ sector above is actually the weighted average of seven indexes for different industries – specifically: Retail; Wholesale; Manufacturing; Construction; Transportation; Agriculture, Forestry and Fisheries; and Financial, Business & Other Services. In some unfortunate language, the combined index of these sectors is then titled “Total”, but a footnote indicates that “Total excludes mineral sector”. Table 7 on page 172 in the 2019 Budget Volume 1 describes it as “Total Non-Mineral”. The BPNG Table 9.7 also uses the older term “Mineral” for the column covering all of the resource sector – now including LNG. For the purposes of this explanation (as it will link with a forthcoming discussion of GDP), the combined index is called “Non-resource sector” and the “Mineral” index is called the “Resource sector”. The best recent summary of PNG’s overall employment picture was provided in the PNG Institute for Public Affairs June 2015 publication by L.T. Jones and P. A. McGavin and titled “Grappling afresh with Labour Resource Challenges in Papua New Guinea: Discussion Paper No. 96”. Figures for the structure of the labour force are provided in their Table A8.2.1 which shows the Census estimates of 360,732 formal sector jobs with 9,011 of these being in the “mining and quarrying” sector. Using the “Mining and quarrying” sector, 9,011 formal sector employees in 2011 is linked the BPNG mineral employment index for that year of 163.6. The remaining 351,721 formal sector employees are linked to the “Total non-mineral” index of 159.4. The employment index figures are available from BPNG QEB Table 9.7 and movements in actual numbers can then be mapped to movements in the indexes shown in the “Employment – Indexes” graph above using the simple formula “Current time employment index divided by 2011 employment index times 2011 actual employment figure”. BPNG has had some concerns about the detailed accuracy of the Census results, so has been reluctant to put its indexes into specific job number terms. They were much more confident about mapping employment trends rather than specific numbers of jobs. While understanding these concerns given the difficulties of getting good statistics in PNG, possibly the PNG Treasury would not be making such fundamental errors in assessing employment trends if actual figures were used rather than indexes – at least you can add actual figures together. And putting these figures into a similar simplified graph over the same time frame as the original PNG Treasury chart, the overall result (using year figures where available to help smooth out trends) we get the following graph. This is the same data as presented above, except the resource and non-resource sectors have been combined and the time period only starts in 2010.

This looks very different than the economic graph provided to the papers.


PNG and LNG – remembering the costs

PNG gave PNG LNG a tax subsidy of at least K504.3 million in 2017. I nearly choked on my breakfast when I came across that number on page 126 of the 2019 Budget Volume 1 produced by the PNG Treasury. It is the conclusion of a section described as “briefly summarizes the tax expenditures provided to the PNG LNG project and the estimated revenue foregone” – see here with the budget paper available here.

I remember the difficulties I had in explaining the low tax revenues received from the PNG LNG project in a major report I prepared earlier this year (see here).  PNG’s Institute of National Affairs had similar difficulties – see here. The quantification of these tax subsidies by the PNG Treasury and IRC helps explain some of the gap between the promise of PNG LNG and its realities.

This was a very timely reminder of the enormous importance of getting a good return for PNG from its resources. For at about the same time that I was choking on the K504.3 million number, PNG was signing another deal for another major LNG project.

This morning, before the start of the APEC CEO summit, PNG signed an MOU with Total, Oil Search and Exxon Mobil for a new Papua LNG project – see here.

Without having access to the details of the MOU, my great hope is that it will work to get much better fiscal returns than PNG LNG. There is no doubt that the PNG Prime Minister and Treasurer are aiming for a better deal. Indeed, it is positive that the agreement signed this morning was only an MOU and not the Final Investment Decision, as there were fears that wanting to have an ‘APEC announce-able’ could have rushed PNG into another poor deal.

The tax expenditure analysis  of the PNG LNG project is extremely useful in highlighting how even the smallest details of negotiations can have enormous impacts.  For example, the thin capitalisation rules allow resource companies to have a maximum debt to equity ratio of 3 to 1 for interest deductions, when normal companies have a 2 to 1 limit. Sounds boring and technical. But the cost from this single tax incentive in 2017 for the PNG LNG project was K170.1 million. And these are annual figure costs – the estimate was a tax subsidy under this single provision of an additional K153.2 million in 2015 and K108.9 million in 2016. The PNG LNG resource companies are exempt from “interest withholding tax”. Once again, sounds rather technical and not necessarily that significant. The cost in 2017 was K304.6 million – half the entire cost of tuition-fee free education for this single tax concession for a single project.

The analysis included in the 2019 Budget also highlights that the K504.3 million tax subsidy in 2017 is the absolute minimum estimate. The report goes through 10 possible tax incentives, and concludes that it only had enough information to cover 4 items with a fifth (infrastructure tax credits) covered elsewhere. The most significant of these would be the “dividend withholding tax exemption” where PNG project partners do not have to pay the normal dividend with-holding tax of 15%. A back of the envelope calculation gives a likely cost of around another K600 million. This is based on the 2019 Budget estimate of a K800 million payment from Kumul Petroleum Holdings – KPH – in 2019, allowing for KPH only having to pass on 70% the dividends it actually receives from the PNG LNG project – let’s be generous and say they pass on 80% which implies KPH gross dividend of K1 billion –  KPH having around a 20% share in the PNG LNG, implying around K4 billion in dividends to other project partners – almost all of which are non-residents – and applying a 15% DWT tax to K4 billion implies foregone revenues of K600 million.

Adding this to the earlier K500 million figure implies tax revenue losses of over K1 billion per year from the PNG LNG project.

Inclusion of more tax expenditure data in the budget was a prior action required for PNG receiving budget support from the World Bank (see below). Having been responsible for the production of Tax Expenditure Statements in Australia, I know they can be extremely valuable in informing policy and budget decisions. An explicit expenditure subsidy is essentially the same as a tax expenditure when it comes to resource allocation. However, tax expenditures are often hidden from public view, and don’t face the scrutiny of an annual budget process. The increased transparency on estimating tax expenditures is a very welcome development.

Given today’s events, its publication could not have been more timely. We do need to remember the costs of providing tax incentives – and forgoing revenue means forgoing possible funding for PNG’s development challenges.

I wish the PNG negotiators the best in securing a better financial deal on future LNG and other resource projects. Hopefully, I won’t have trouble eating my breakfast when the 2029 Budget provides details on the size of any tax concessions provided for Papua LNG!


PNG 2019 Budget – Health cut despite polio and drug shortages, Administration big winner but political

Summary

The 2019 PNG Budget is an expansionary one. The biggest sectoral feature of the budget is a transfer of K1,080 million in expenditure responsibilities from the Provinces sector to the Administrative Sector. The political ramifications of this will be interesting as it implies a transfer of power to the central government,  away from Provinces and Districts, and allows more administrative control over parliament by the Executive. The big funding winners were the transport and utilities sectors. Despite medical shortages, the health sector was cut by 2 per cent after allowing for inflation. Education received only a 1% increase despite the Medium Term Planning requirements for a massive increase in teachers. Taking a longer-term perspective (from 2015 to 2019), there have been real cuts in transport of 36%, education of 30%, in health of 17%, in law and justice of 17%. The big longer-term winners have been utilities, debt service, the economic sector and administration.

Details

Methodology

Language in budgets always talk about supporting the so-called development “enablers” of health, education, infrastructure and law and order (the economic sector currently makes this list but it didn’t in some earlier plans). However, actual expenditure patterns have often not matched the policy language.

Below are tables providing sectoral expenditure figures from Budget documents covering 2015 to 2019. Adjustments have been made to debt service expenditure figures to match those in other tables in budget documents. As a word of warning, there is some judgement in determining if a particular item fits in one sector or another – the following tables draw on PNG Treasury’s assessments (presumably working with the Department of National Planning and Implementation). However, their information systems are imperfect.

The first table includes all figures in nominal values (so not allowing for inflation) – they come straight out of official budget figures. However, when doing comparisons over time, it is important to allow for the fact that a Kina in 2015 could buy more than it could today. Wages have gone up. Many goods and services cost more, although some could cost less due to technology improvements. Ideally, each sector should have its own price index but these are not available. Readers can use their own understanding of a price index for each sector if they wish. The approach used in the table below is to rely on the best available price index – PNG’s average inflation rate from its Consumer Price Index prepared by the National Statistics Office. The second table includes price changes by putting converting budget expenditures into 2019 values using the CPI. Specifically, allocations back in 2015 are now considered to be worth 26% more – a Kina in 2015 could, on average, buy 26% more things that it can now. 2016 items are on average worth 19% more, 2017 11% more and 2018 5.6% more. Readers can use their own price indexes if they wish.

As price changes through time are included, the second table is the better one for comparison through time. The table includes changes between the 2018 and 2019 budgets in the seventh and eighth columns, and between the 2015 and 2019 budgets in the ninth and tenth columns.

Provinces to Administrative

For the 2019 budget, by far the biggest change is the cut in the Provinces allocation by K1,072 million, or some 26%. This reflects shifting responsibilities for the District Services Improvement Program (DSIP) and the Provincial Services Improvement Program (PSIP) – worth a total of K1,080 million – to the Administrative sector. In the 2019 Budget documents, it is explained that the funding has been transferred to the Department of Implementation and Rural Development (DIRD). From a budgetary perspective, this is just a transfer of funds. From a political perspective, there are more significant implications. In Australia, such as transfer would cause a massive rift in Commonwealth and State relations. The large increase in local member and Governor constituency funding was a signature policy of the new O’Neill government  in 2011 – a promise to provide K10 million to local members and Provincial Governors reflecting O’Neill’s earlier views on increased decentralisation. There have been serious doubts about whether K10 million was too much, whether it has been well spent, and whether there has been enough accountability for this expenditure. Possibly the major transfer could be seen as a good administrative move for fiscal accountability given poor reporting under previous systems, but it is likely to be a politically sensitive change.  It is known that these constituency funds are highly political and are withheld or delayed from opposition members and used to increase the numbers on the government’s side of parliament. This practice is probably illegal under the constitution, and the opposition has threatened to take the government to court. By moving these funds under the control of a Minister, there is probably a way around this legal challenge by saying the relevant Minister has made an administrative decision not to release funds, for example because not enough detail had been provided in the quarterly report. If this was done in a consistent and transparent way, this could be an improvement. However, there clearly is scope for inconsistent treatment for political objectives. Given the importance and power of constituency funds, this appears to be a major shift in power from the Legislative to the Executive. Possibly expect fireworks behind what otherwise appears as a simple funds transfer.

Health

The 2019 Budget has a 2% real cut in health funding despite reports of major basic medicine shortages. It is hard to reconcile this real cut with the proposed massive increases in the number of health workers. Of course, the 17% real cut in funding over the last five years is also of concern and may have contributed to the outbreak of polio and increasing incidence of TB and Malaria. Talk of “free health” has always been a fiction with an allocation of only K20 million a year since 2012. Recent reports indicate parliamentarians have suffered from this deception when seeking even basic anti-malarial drugs.

Education

Education did slightly better with a 1% increase in real funding. Education was initially a big winner in 2011 with the introduction of Tuition-Fee Free Education at a cost of K600 million. This K600 million actually didn’t increase funding for the education system in terms of better schools and more teachers. Rather, it was primarily a cash transfer to parents as they no longer had to pay school fees. Education funding has been cut in real terms by 30% since 2015. There are reports that education standards have been declining – indeed, this has been acknowledged in the latest Medium-Term Development Plan.

At this stage, I have not gone through the detail of the significant funding for infrastructure and utilities. On the face of it, this would be welcome. Possibly, most of this funding could be from donor sources given recent announcements and the proposed shift in external funding towards infrastructure. The economic sector has held onto its large increase in 2018. The direct support for commercial equity in private operations has not worked in the past. Much more could be said – but to get this blog out quickly, just the numbers are provided in the following two tables:


PNG’s 2019 Budget – Loss of Fiscal Discipline

This is the first of a series of articles that analyses the 2019 budget primarily through its numbers rather than its words.

Summary

The 2019 PNG Budget moves away from fiscal discipline, and potentially towards yet another boom/bust cycle for PNG. The 21 per cent increase in expenditure from 2017 is risky and depends on high oil prices and GDP growth rates. The fiscal anchor for 2019 has been severely breached due to spending almost all of the K1 billion bonus from higher oil prices – this is probably illegal under PNG’s Fiscal Responsibility Act. The sudden reversal in fiscal policy towards a loose setting is probably the major short-term policy concern from the 2019 Budget.

Details

The 2019 Budget Strategy released on 29 August indicated expenditure in 2019 was expected to be K14,955.6 million. This was a modest increase from the expected expenditure in 2018 of K14,718 million.

On 13 November, the 2019 Budget was for expenditure in 2019 of K16,133.5 million, an increase of K1,415.6 million or 9.6 per cent in the course of just under 3 months. One would have hoped that the usual reasons for expenditure growth between years had been fully built into the 2019 Budget Strategy (payment of any wage increases, plans for the Medium Term Development Plan which is entirely based on the 2019 Budget Strategy). The quality of this extra K1.4 billion in expenditure may need close scrutiny.

There has been a significant reversal in fiscal policy. There was a major reduction in budget expenditure from K15,454.1 million in 2014 (actual) down to K13,319.7 million (actual) in 2017. In nominal terms, this has now been entirely reversed with 2019 budgeted expenditure of K16,133.5 million – representing an increase since 2017 of 2,813.8 million or 21.1% (a future article on the sectoral composition will analyse the pattern of expenditure changes).

This represents a significant loosening in fiscal policy. Indeed, beyond these nominal changes in expenditure, the 2019 Budget Strategy estimated that the deficit would be K442 million in 2019 or 0.7% of non-resource GDP. Instead, the 2019 Budget lifted this deficit to K1,743 million or 2.7% – an increase of K1,301 million. Given the high non-resource primary deficits from 2016 to 2019 (specifically, -4.6%, -1.7%, -2.2% and -2.7%), it is virtually impossible to reach an average zero balance in the medium term, especially given current directions in fiscal policy. This would be a breach of PNG’s Fiscal Responsibility Act agreed by Parliament in only September 2017.

This is a very different fiscal story than the one included in the 2019 Budget Speech.

The fiscal expansion and loosening of fiscal policy is the key short-term policy concern of the 2019 Budget.

Specifically, although the traditional PNG budget deficit slightly decreased, PNG agreed as part of its 26 October budget support loan from the World Bank that it would use a new fiscal deficit measure – the non-resource primary balance. Legislation was passed in the PNG Parliament in September 2017 to make this the new fiscal measure, indicating that it should average zero over the medium-term. This was the first condition for the $US150 million in budget support from the World Bank (called “Prior Action 1”). Changing the legislation and incorporating this measure as the key for its Medium-Term Fiscal Strategy was the key condition for releasing the first tranche of World Bank budget support. Current figures indicate that PNG will not receive the second release of the budget support assistance.

Extracts from the World Bank documentation (page 22) dated 26 September 2018 go into detail below.

The extra revenue derived in 2018 flowed mainly from high oil and gas prices. It is unclear how long these will continue. Going forward, the revenue estimates are based on very high GDP growth rates. A future analysis will look at the GDP figures. On balance, there is a distinct risk that PNG is heading back into a boom/bust budget cycle.

2019 PNG Budget Analysis Guide

There will be hundreds of people looking to do an analysis of the budget and what it means for the future of PNG.

Following is a 10 point guide from someone that started analysing PNG’s budgets back in 1978 and once used to be able to get into the media lock-up (but can’t now as I’m banned from the country).

1. Be prepared

The 2019 Budget needs to be looked at in comparison to recent budget documents and reports. So bring along at least electronic copies of the 2018 Budget, the 2018 MYEFO, the 2019 Budget Strategy (all available from the Treasury website) as well as the 2018-2022 Medium Term Development Plan (available from the National Planning Website). This is just useful for checking if the budget is doing what the government said it would be doing.

Also bring along the latest figures from respectable outsiders – so the latest figures from the IMF and World Bank are probably most pertinent. The latest World Bank and IMF’s analysis of the PNG economy is included in the following document as part of its assessment for providing budget support, including the agreed actions for the $US150 million in support – available here. The latest IMF Article IV report is also helpful, as is the UPNG/ANU PNG draft economic survey – available here.

2. Don’t start reading the words – start with the numbers.

This may sound strange, but I always recommend that you start with Budget Volume 1, go to the last Annex (about page 120 or so) and begin with Table 1 titled “Gross Domestic Product by Economic Activity” – or GDP for short. It is an attempt by economists to measure the size of the economy.

This is the first fundamental test of the credibility of the budget, and therefore any of the words in the budget speech and Executive Summary. Table 1 has lots of interesting information for economists and industry analysts, but for budget analysis the key figures are at the bottom of the table – what is the government saying is the size of GDP and how quickly is it growing?

Following is a quick table with recent previous estimates of GDP – this guide will have some tables where 2019 Budget figures can be inserted (usually in the green sections) and then compared with what the outside experts are saying (and these experts get to have a good look and sometimes actually even operate the relevant background models in PNG Treasury).

Nominal GDP (Kina Billions) 2013 2014 2015 2016 2017 2018 2019 2020 2021 2022 2023
IMF – bottom of page 54 except for 2013 figure from 2017 IMF Article IV) 47.7 56.8 57.1 59.3 63.8 68.0 71.7 75.5 80.5 85.9
PNG National Statistics Office 47.7 56.7 57.1 na na na na na na na
2018 Budget 47.7 56.6 62.2 67.8 73.9 80.1 85.9 92.2 99.1 107.0
2018 Budget Strategy 75.6 81.9 86.9 92.9 100.2 108.9
2019 Budget

First, it can indicate if some games are being played – especially if there are big differences between what the PNG government says, and what its own National Statistics Office and outside agencies say. For example, we know that everyone agreed essentially on the size of the PNG economy in 2013 and 2014. There has been agreement that the NSO figures once produced are the most accurate available and should be used (they actually work with the Australian Bureau of Statistics to produce these figures). However, the National Statistics office released in March 2018 a new estimate for the size of the economy in 2015 which was substantially lower than the PNG Treasury’s. The World Bank and IMF use this new NSO estimate. This new GDP estimate for 2015 should have been used in the 2019 Budget Strategy but it wasn’t. This then produces very big gaps between what the IMF and World Bank estimate as the likely size of the economy, and what the PNG government claims – a gap that continues to grow. Hopefully, the 2019 Budget will use the 2015 GDP figure estimated by the National Statistics Office. If not, the budget fails the first sniff test.If there are big differences between what the IMF/World Bank estimate – top line – and the 2019 estimates, why does this matter?

GDP ends up affecting the budget in three important ways.

First, many of the fiscal responsibility ratios are based on GDP as the base. For example, the debt to GDP ratio is not supposed to exceed 35%. If you have a bigger GDP number, it means you can have more debt without breaking the law. Likewise, the fiscal deficit number is expressed as a share of GDP – so a bigger GDP means your deficit figures look better when put in terms of “% of GDP”. Big increases in expenditure look more reasonable if expressed as a percentage of rapidly growing GDP. An example of this effect is given below which provides the level of public debt, and then expresses it as a percentage of GDP.  The bottom row using current 2018 Budget and 2019 Budget Strategy figures for public debt, and dividing them by the World Bank/IMF/NSO GDP estimates, shows the Fiscal Responsibility Act actually has been breached since 2016 (so figures greater than 35). This is a very different result than the figures used in the 2018 Budget and 2019 Budget strategy. Will this change in the 2019 Budget?

Government Gross Debt Kina Billions 2013 2014 2015 2016 2017 2018 2019 2020 2021 2022 2023
Implied figure from IMF’s GDP and debt to GDP ratio – interestingly a bit lower govt 11.9 15.4 18.4 21.9 23.5 24.5 25.8 27.0 28.6 30.2
2018 Budget Vol 1 Ann 3 Table 15 18.0 21.9 23.8 25.8 27.7 29.4 30.8 32.1
2018 Budget Strategy Table 3 p13 25.8 27.4 29.1 30.5 31.8
2019 Budget
Government Gross Debt Share of GDP 2013 2014 2015 2016 2017 2018 2019 2020 2021 2022 2023
IMF/World Bank page 54 for 2014-22 and IMF Article IV for 2013 24.9 27.1 32.2 36.9 36.9 36.1 36.0 35.8 35.5 35.2
2018 Budget Vol 1 Ann 3 Table 15 29.0 32.4 32.1 32.2 32.2 31.9 31.1 30.0
2018 Budget Strategy Table 3 p13 32.2 31.8 31.6 30.8 29.5
2019 Budget
Memo item – implied debt ratio using PNG govt debt figures and IMF/WB GDP figures 31.5 36.9 37.3 37.9 38.2 38.5 37.9 37.0
Re-calculate new 2019 Budget Public Debt Figure using NSO/IMF/World Bank GDP numbers (so public debt figure divided by actual GDP figure as a percentage)

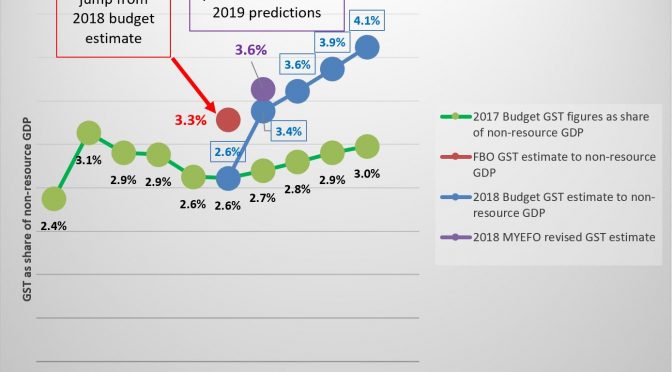
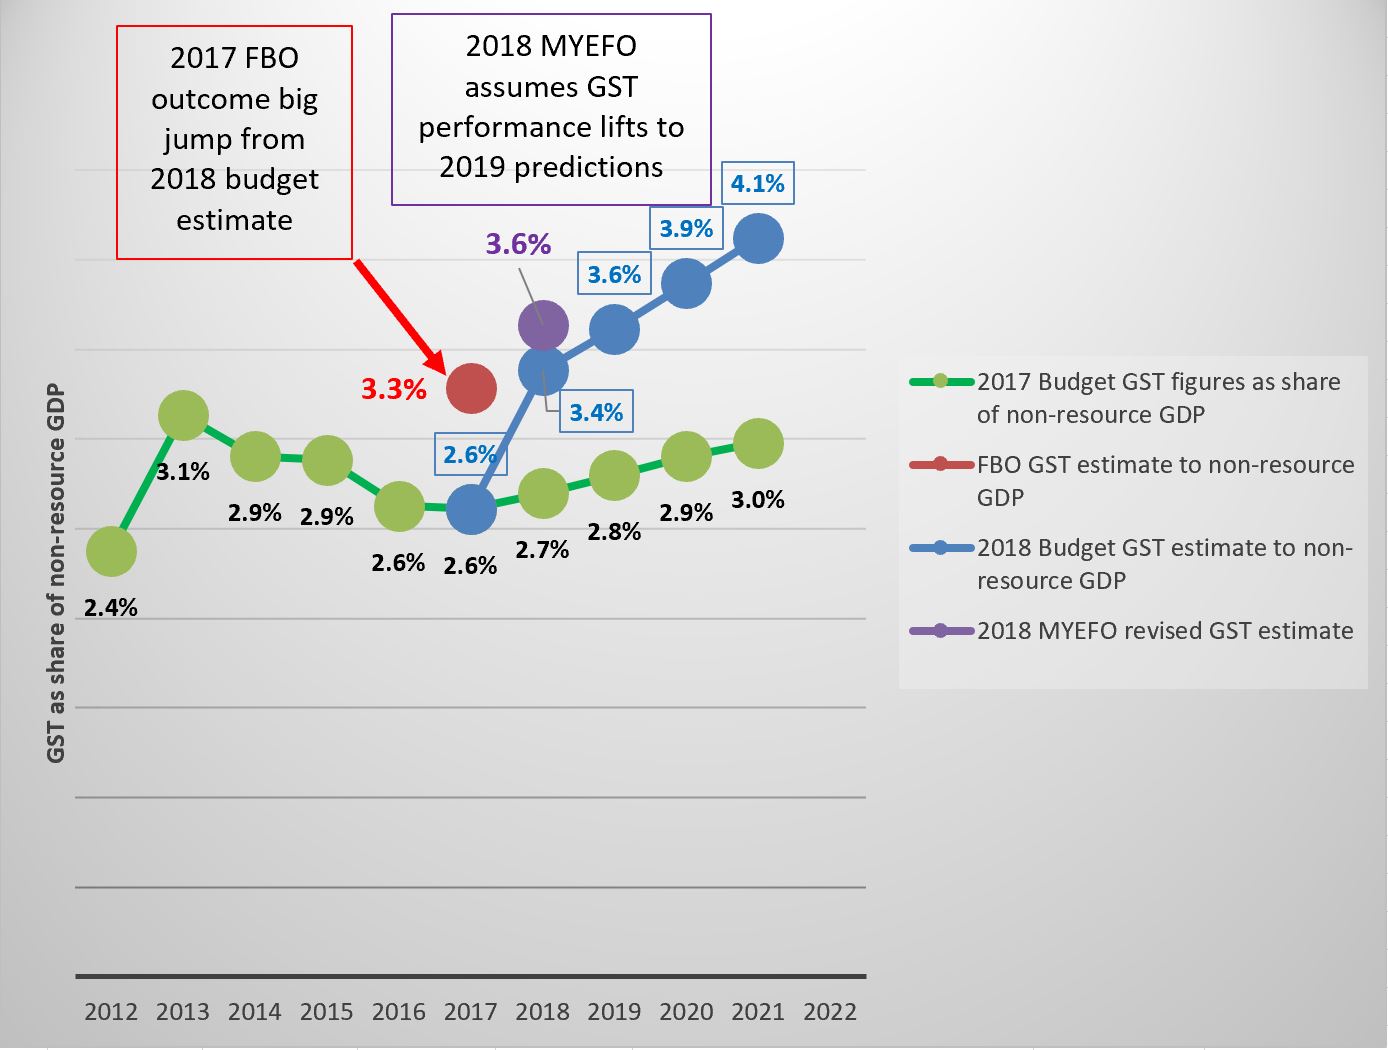
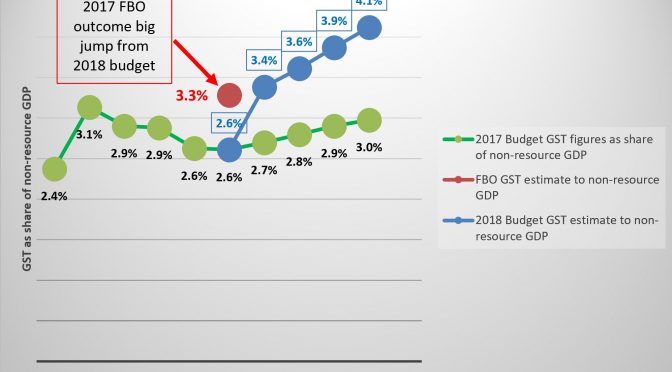
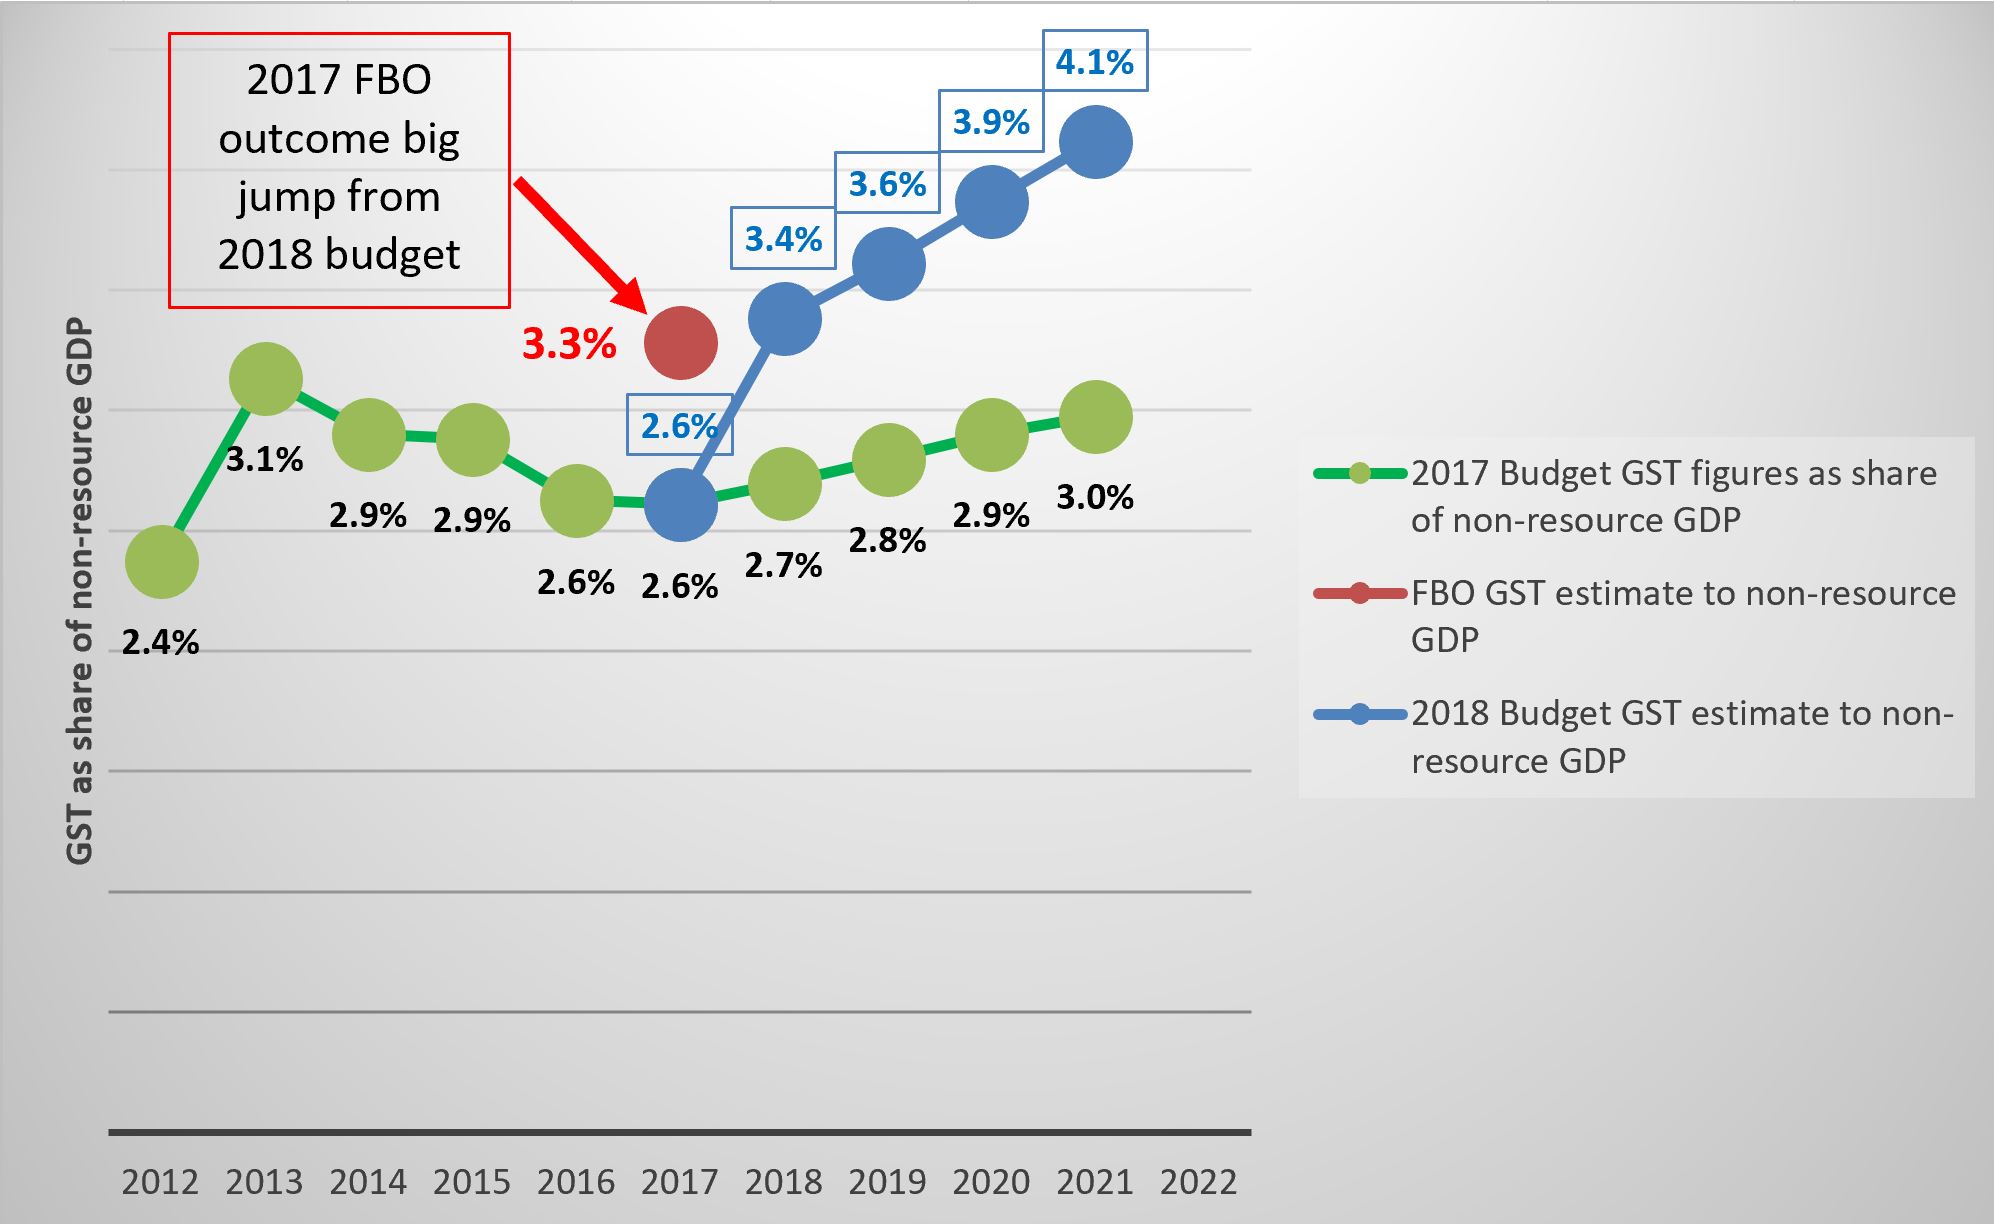
Second, revenue forecasts depend critically on nominal GDP forecasts. This is because the major sources of tax revenue are linked to parts of the measure of GDP – so wage income (the personal income tax), business income (company tax), the level of consumption (the GST) and various import and export taxes. Without changes in tax policies, there is often a near direct link – so assuming wage income is 20% higher probably means personal income taxes will be 20% higher (and possibly a bit more given bracket creep). So if the GDP number is too big relative to realistic forecasts, it probably means that revenue forecasts are also too high. If expenditure stayed at the same level, then we would expect that lower revenues would then lead into bigger deficits. So getting the GDP number seriously wrong probably means your entire fiscal strategy over the next few years will also be seriously wrong. So over-estimating GDP can lead to much bigger deficits and loose expenditure policy; under-estimating GDP can lead to smaller deficits and paying debt off more quickly.

Third, the GDP growth figures can provide another benchmark on how the economy has been going and the expectations of the government on how growth will perform in the future. Clearly, a negative number indicates a recession, and things are going badly. A very high number can also indicate excessive optimism. If there are very high growth numbers, are there very sound reasons for them? The usual approach, based on the experiences of PNG’s history and those of other countries, is not to bet on extremely high growth rates. For high growth rates push up the expected levels of revenues, which means that government’s can be tempted to plan to spend too much, which then pushes up debt and can trigger a boom/bust cycle. The best measure of PNG’s economic living standards are based on non-resource GDP (as most of the resource sector is foreign owned) after allowing for inflation – this is called “real non-resource GDP”. Real GDP figures are also useful. Negative numbers indicate a recession. Figures for both measures are shown in the following tables. The 2019 Budget Strategy growth figures started pushing the edges of credibility, especially by 2022 for non-resource growth. Will the 2019 Budget use more realistic growth assumptions?

Real Non-Resource GDP growth rates 2013 2014 2015 2016 2017 2018 2019 2020 2021 2022 2023
IMF/World Bank page 54 for 2014-22 and IMF Article IV for 2013 3.6 7.0 -3.1 -0.1 1.9 1.4 1.9 2.3 2.8 2.9
2018 Budget Vol 1 Ann 3 Table 1 3.6 3.3 0.7 0.7 1.9 3.5 3.5 3.6 3.3 3.3
2018 Budget Strategy Table 2 p11 0.2 2.8 2.9 4.2 5.0 6.9
2019 Budget
Real GDP growth rates
IMF/World Bank page 54 for 2014-22 and IMF Article IV for 2013 3.8 15.4 5.3 1.6 2.5 -1.6 3.5 3.1 3.4 3.5
2018 Budget Vol 1 Ann 3 Table 1 3.8 12.5 10.5 2.0 2.2 2.4 2.2 2.0 2.5 2.8
2018 Budget Strategy Table 2 p11 3.0 1.0 2.3 3.0 4.3 4.5
2019 Budget

3. Stick with the numbers – you can tell I’m a number person!

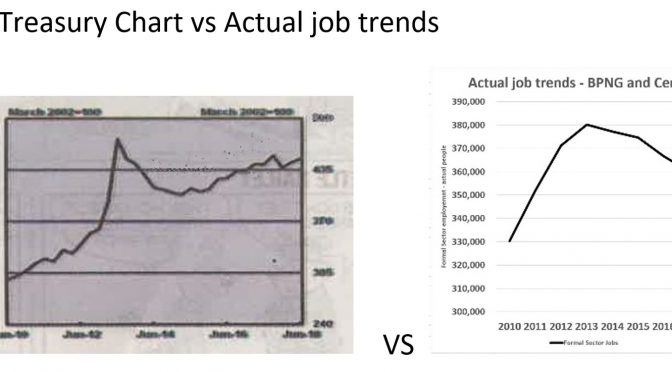
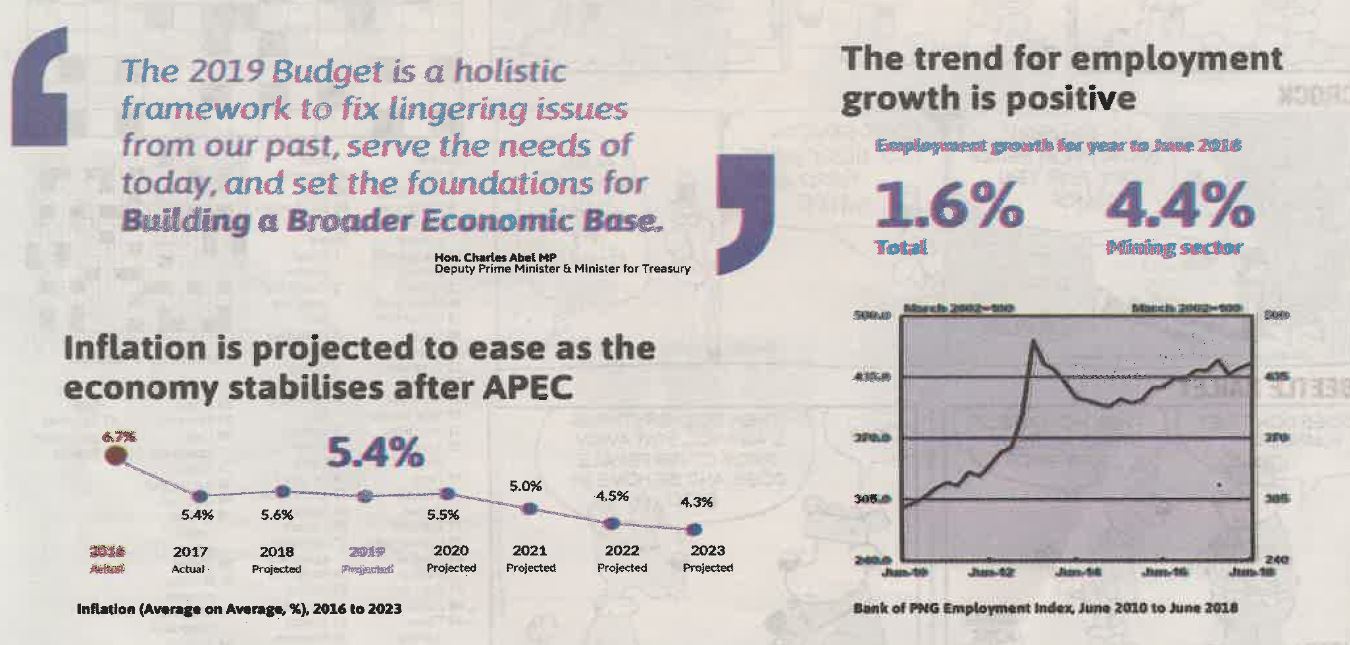
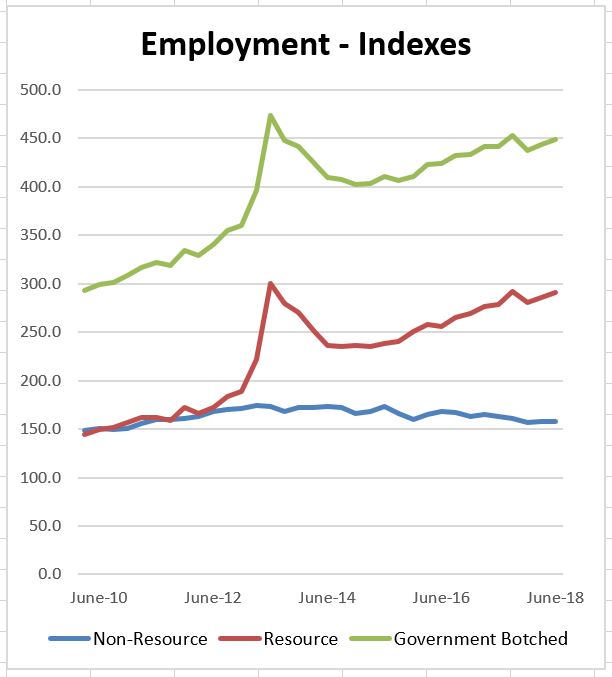
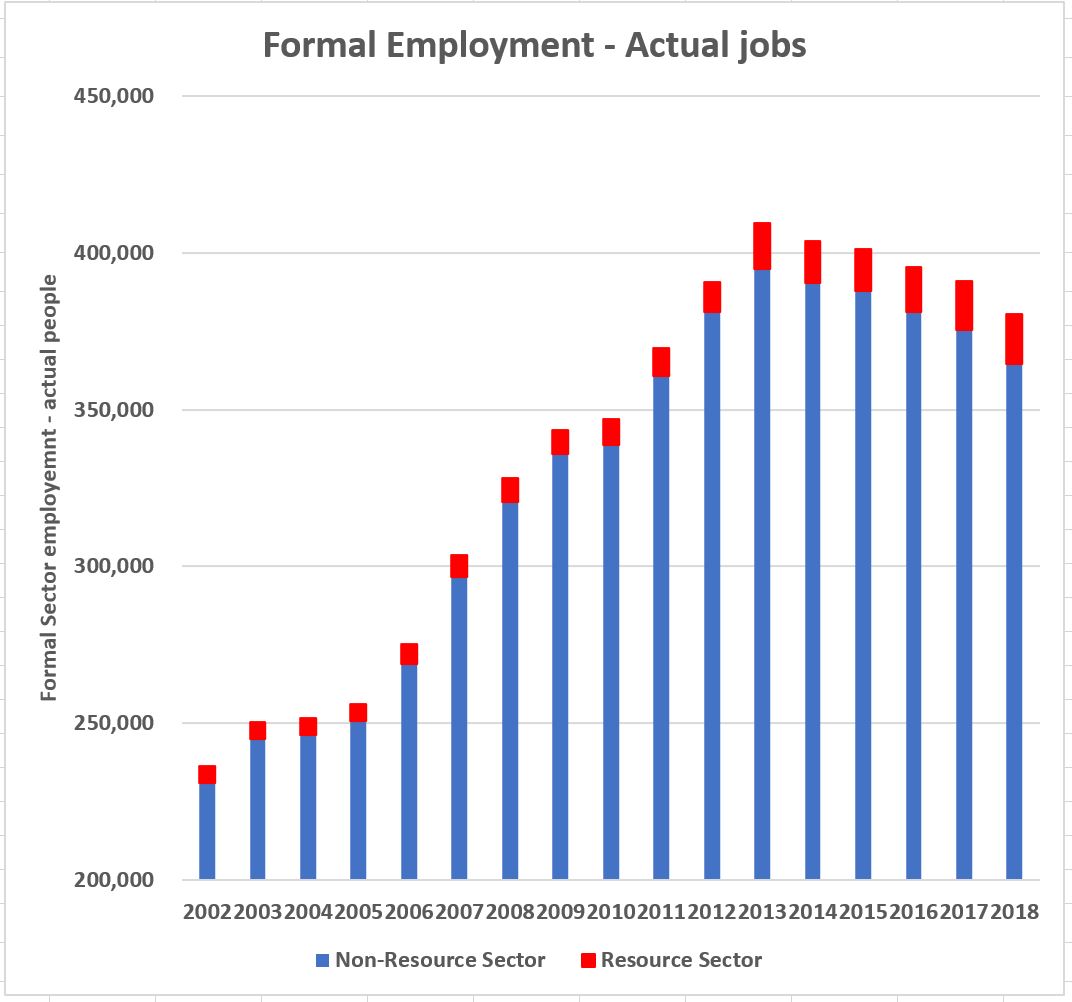
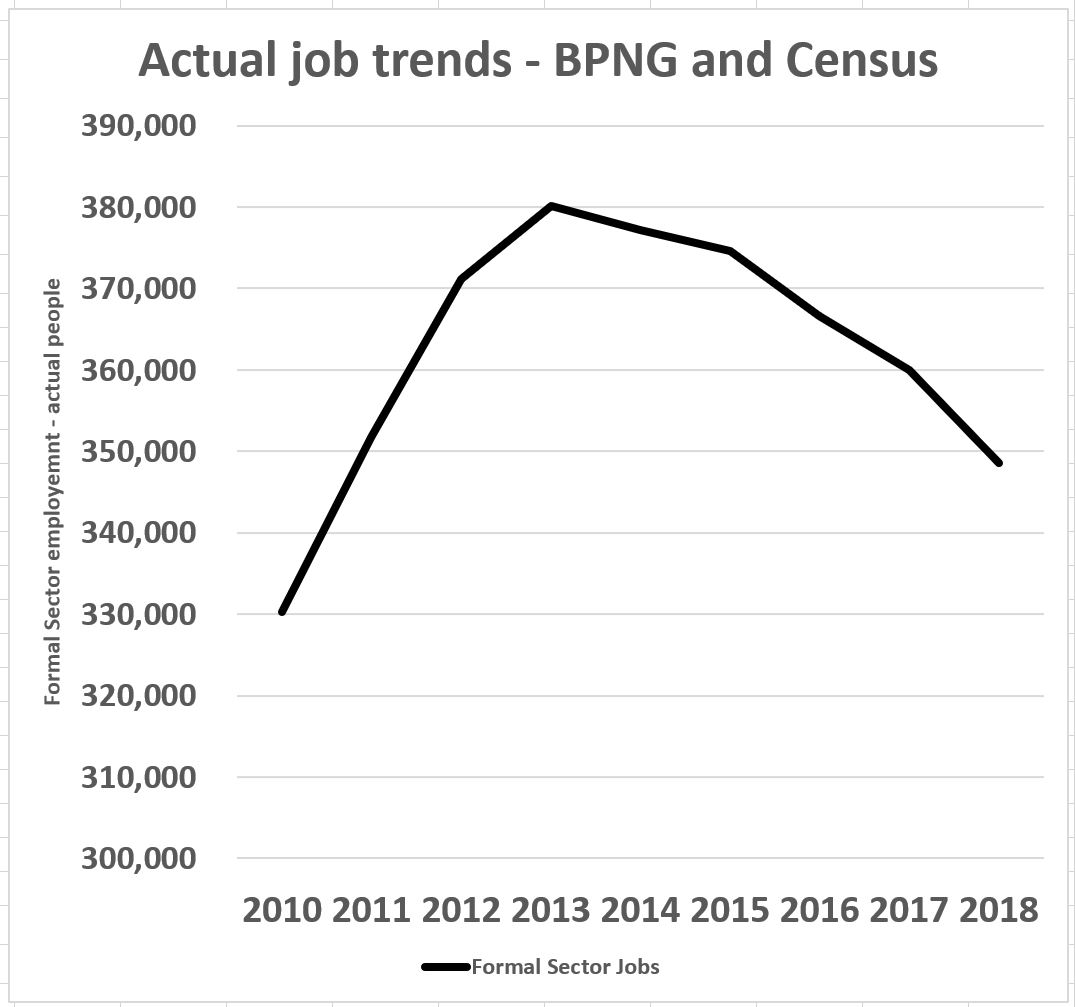
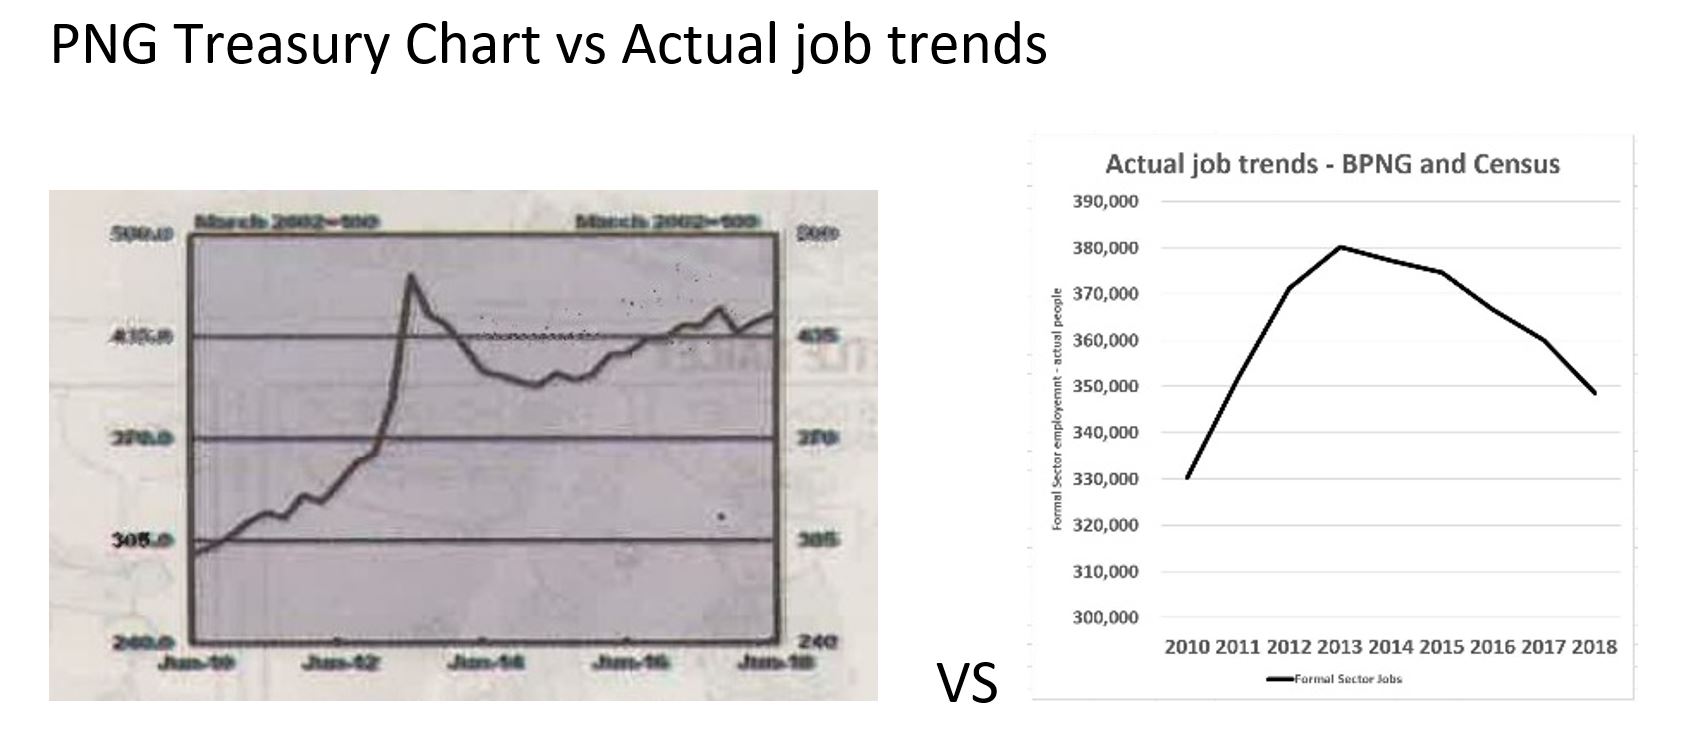
Have a quick look at Table 7 in this back of the budget annex on formal sector employment.  Hopefully the non-mineral employment index would have moved back to at least its level of 172.2 in 2013 – its been falling in recent years.

Have a quick look at Table 8, especially the line on “Credit to the Private Sector”.  This hopefully will be well above the expected rate of inflation – otherwise a sign of a lack of investment in the economy. Unfortunately, this went backwards even before inflation in 2017, and the World Bank and IMF expect it will go backwards again in 2018 by another 4.3 per cent before a modest recovery in 2019. This is hard to explain as the earthquake would have been expected to increase investment rebuilding, as well as some APEC-related work.

Now to Table 10 called “Statement of Operations for General Government”. This table is absolute gold! As long as it is accurate (there were big errors in the 2018 budget between Annex Table 10 page 138 and Table 6 on page 33 but hopefully this won’t be repeated in 2019).

It gives you a wonderful overview of how things have been going on revenues, expenditures, key fiscal deficit ratios, financing and even a double check on the GDP numbers (the latter can vary between the various tables – Table 1 is the best source)

Actually, you almost don’t need to read anything else in the entire budget except for key announcements about any tax changes, expenditure initiatives and sectoral spending composition!

Given the boom in oil/LNG prices, it will be interesting to see how much of a tax windfall has been received from the resource sector in 2018, and if this is expected to continue. This is combined in the lines under ‘resource revenue’. Revenue as a percentage of GDP is also interesting, although World Bank will be looking more specifically at the tax to GDP ratio. The figures on Compensation of employees (payroll for public servants and teachers) is vital for seeing whether this largest category of expenditure is being bought under control. The line on interest costs is also interesting – has this been bought under control? There are then five measures of the difference between types of revenues and types of expenditures.  Sounds boring, but this is actually the key budget policy reform that has been introduced by Treasurer Abel. So the focus used to be the “Net Lending/Net Borrowing” line. This is the difference between all revenues and all expenditures – it is the same number  you need to borrow and impacts directly on public debt levels. It used to be the focus of looking at the fiscal deficit.

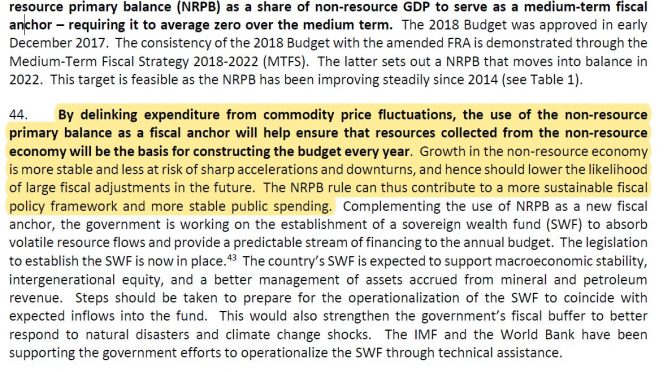
However, that is now old hat. The Treasurer has committed to the focus being on the “non-resource primary balance”. Indeed, the PNG Parliament agreed that this would be the new “fiscal anchor” for PNG’s budget strategy and has legislated that the aim is to have a zero non-resource primary deficit over the medium-term. So what is this new measure? Essentially, the aim is to de-link budget spending from the ups and downs of volatile commodity prices. This is done by excluding all resource revenues. The aim also is to focus on the current situation rather than problems from the past, so all interest costs are also excluded (this is the “primary” reference).

This then gets to probably the key issue in the entire 2019 budget in terms of fiscal policy. When the new government came to power and moved to this new fiscal anchor in late 2017 including having Parliament incorporate it under changes to the Fiscal Responsibility Act, interest costs were higher than resource revenues. This meant that the ‘non-resource primary balance’ was lower than the old fiscal deficit definition. This could give the impression that the government was planning to return to a budget surplus earlier than if the old measure was used.

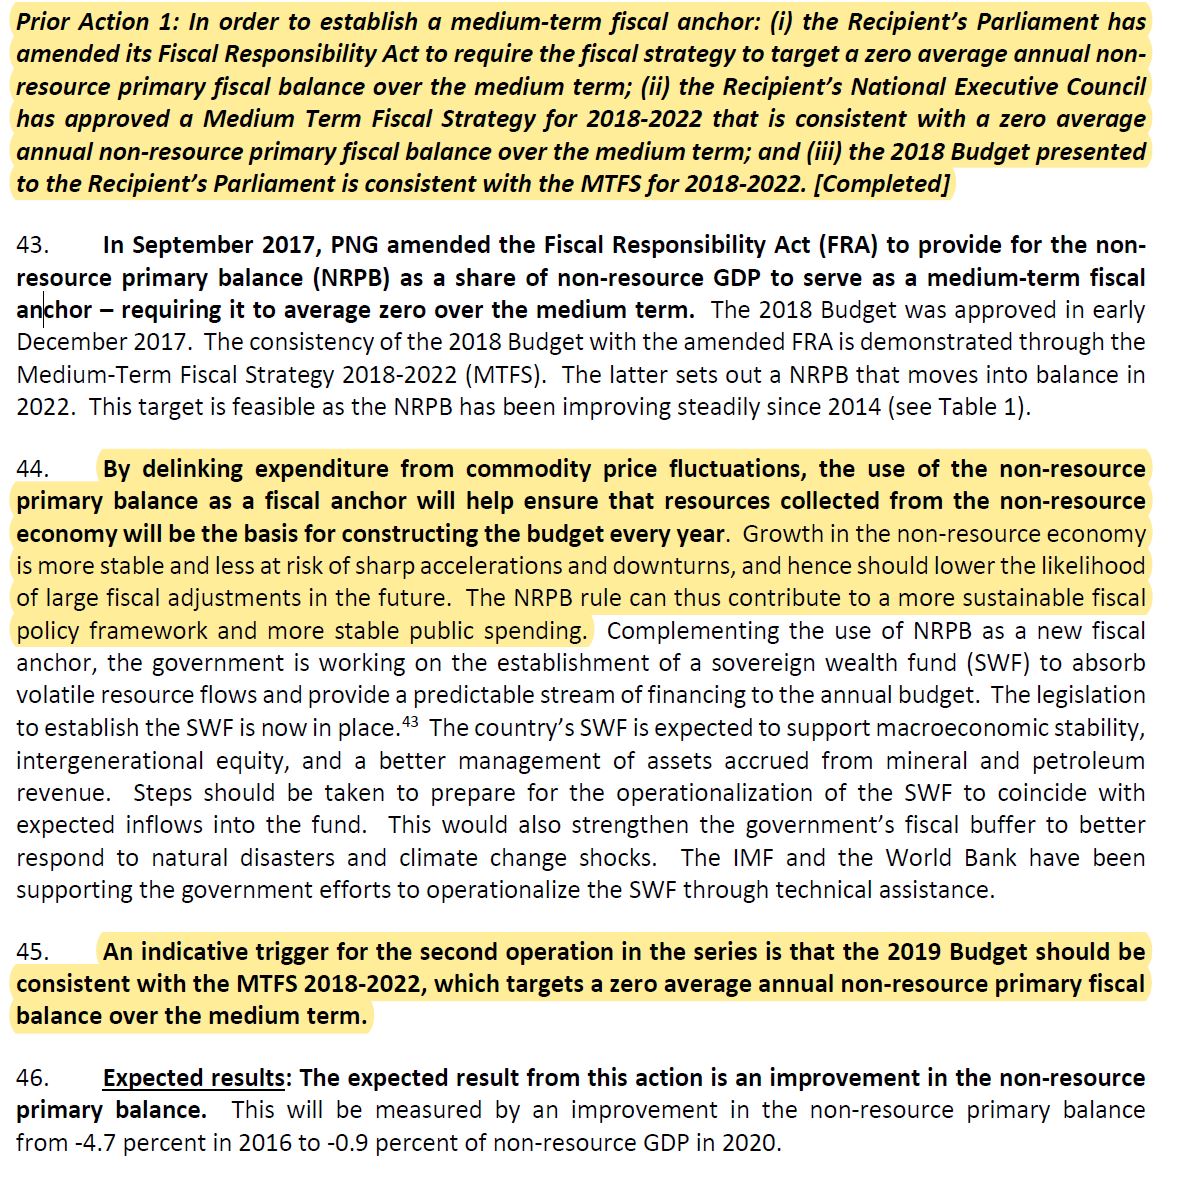
However, and this is interesting, there is talk that resource revenues have absolutely boomed over the last few months. The government then had a choice. One option was to keep to the new fiscal anchor and save the boom in resource revenues by reducing public debt. That’s what they promised the World Bank and IMF when they received the budget support – it is the first point in their agreement. It’s what they indicated would happen in the 2019 Fiscal Strategy released just over two months ago. The other option was that they would spend the extra resource revenue. On the old measure, that would mean the fiscal deficit would stay about the same. On the new measure, it would mean the fiscal measure would blow out.

So in the middle of this table is actually the key story for the budget – continuing fiscal discipline around the new fiscal anchor, or spending as much as possible using the old definitions. Fiscal discipline or big spending – this will be revealed in this line on “non-resource primary balance”. The following table allows figures to be entered for both the level in millions of Kina, as well as percentage of non-resource GDP.

Key Figures for 2019 Fiscal Policy Stance 2013 2014 2015 2016 2017 2018 2019 2020 2021 2022 2023
Non-resource primary balance Kina Millions
IMF/World Bank – don’t give actual figures, just implied percentages
2018 Budget Table 6 p33 -3253 -665 -592 -442 -193 -10 98
2018 Budget Strategy Table 3 p13 -592 -442 -193 -10 98
2019 Budget
Non-resource primary balance (% of non-resource GDP)
IMF/World Bank page 16 for 2014-22 -8.7 -4.7 -4.7 -1.9 -0.3 -1.1 -0.9 -0.6
2018 Budget Table 6 p33 -4.6 -1.2 -1.0 -0.7 -0.3 0.0 0.1
2018 Budget Strategy Table 3 p13 -1.0 -0.7 -0.3 0.0 0.1
2019 Budget

The fiscal discipline/fiscal big spending outcome can also be confirmed by looking at the total expenditure figure between 2018 and 2019. The 2019 Budget Strategy said there would be an increase of a modest 2% or K238 million. How does the 2019 Budget actually perform relative to 2018? Is the expenditure increase more or less than K238 million?

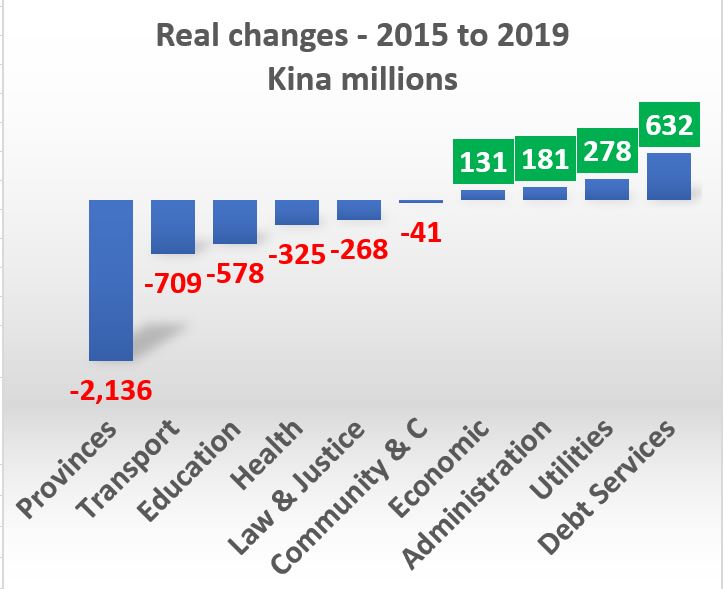
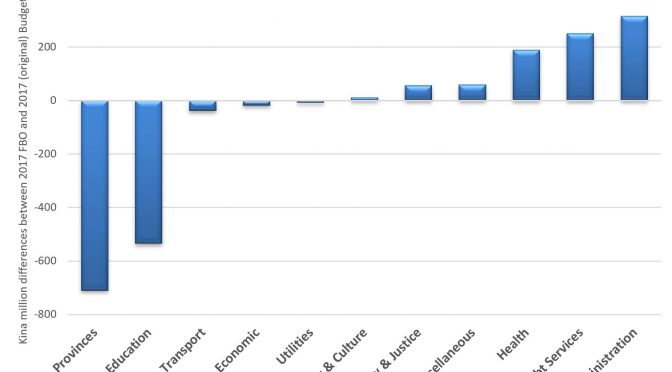
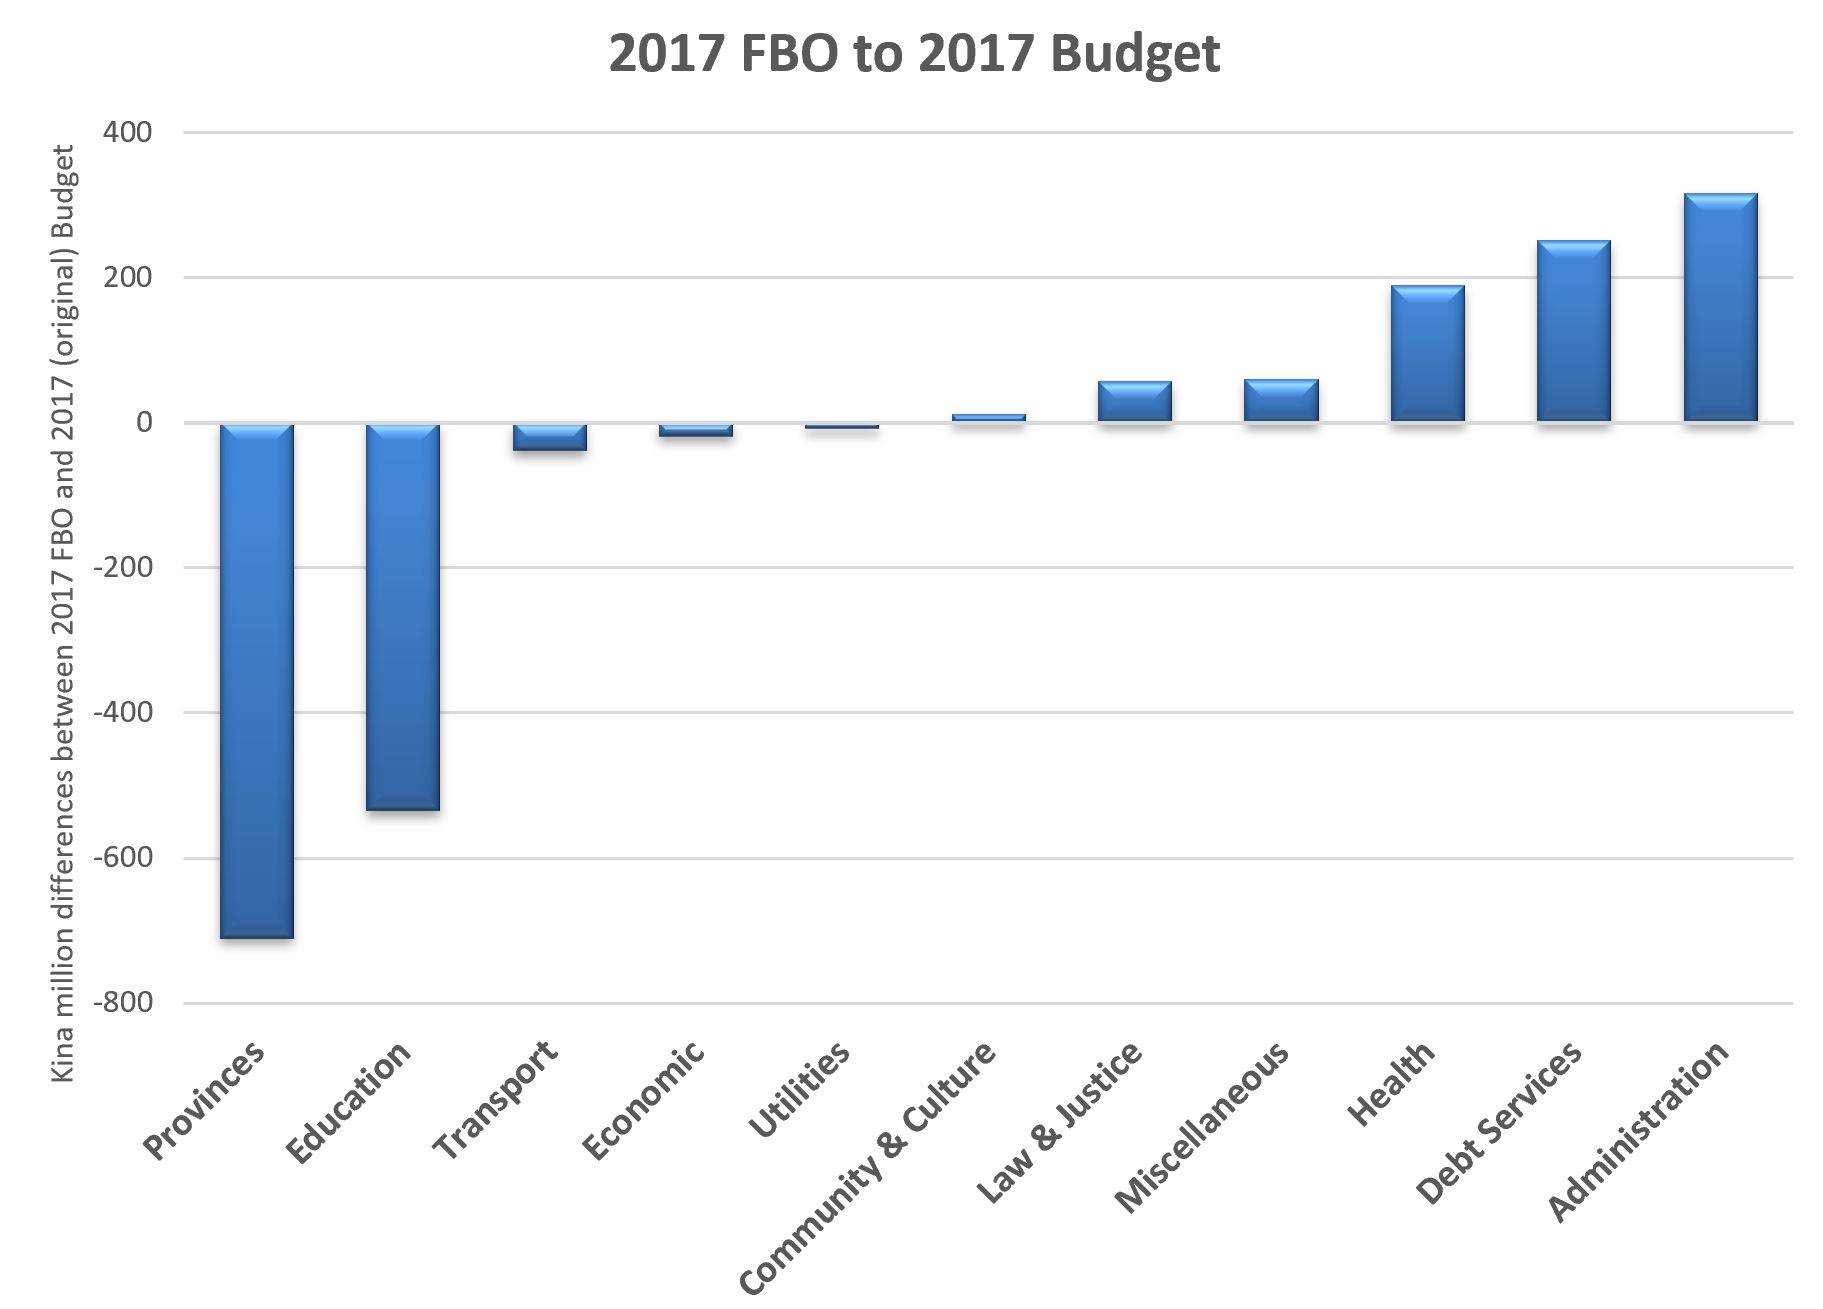
4, Gauge the government’s spending priorities

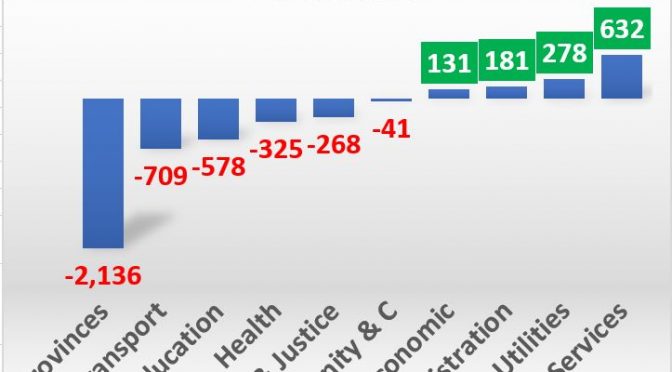
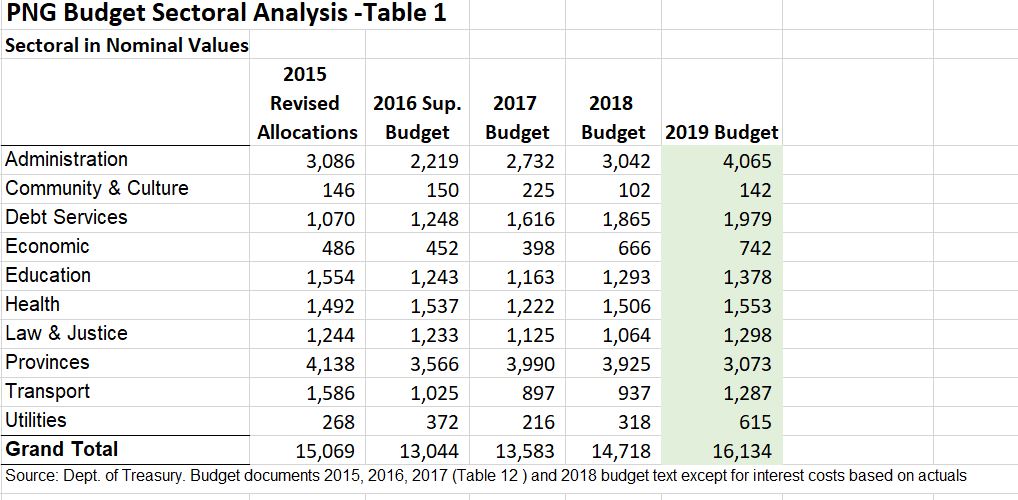
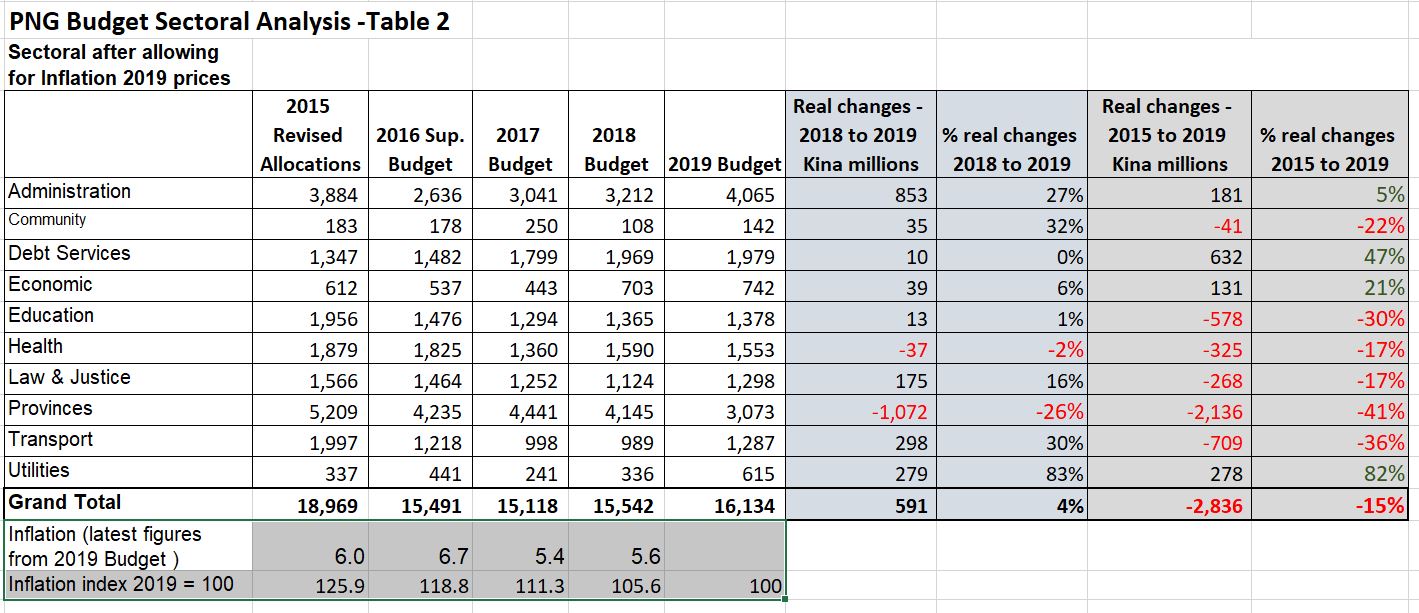
Part of this comes from looking at growth in expenditure on Compensation of Employees and Interest costs mentioned in step 3. There should also be a table that shows the break-up of expenditures between different sectors. Hopefully this is provided back in the Expenditure chapter – previously Chapter 6. The 2018 Budget didn’t have a good table comparing this expenditure through time – it only provided 2018 estimates. However, for the keen, here is a table that can be completed. This provides sectoral expenditure before inflation is taken into account (so nominal values) and one where inflation is included (real values). Taking inflation into account is important as the Kina can buy less in 2019 than it could back in 2015.

PNG Budget Sectoral Analysis
Sectoral in Nominal Values
2015 Revised Allocations 2016 Sup.
Budget
2017 Budget 2018 Budget 2019 Budget
Administration                      3,086                2,219                2,732                3,042
Community & Culture                         146                   150                   225                   102
Debt Services                      1,070                1,248                1,616                1,865
Economic                         486                   452                   398                   666
Education                      1,554                1,243                1,163                1,293
Health                      1,492                1,537                1,222                1,506
Law & Justice                      1,244                1,233                1,125                1,064
Provinces                      4,138                3,566                3,990                3,925
Transport                      1,586                1,025                   897                   937
Utilities                         268                   372                   216                   318
Grand Total                    15,069              13,044              13,583              14,718
Source: Dept. of Treasury. Budget documents 2015, 2016, 2017 (Table 12 ) and 2018 budget text except for interest costs based on actuals
Inflation (latest figures from BSP) 6.0 6.7 5.4 5.9
Inflation index 2019 = 100 126.2 119.1 111.6 105.9 100
Sectoral after allowing for Inflation 2019 prices
2015 Revised Allocations 2016 Sup.
Budget
2017 Budget 2018 Budget 2019 Budget
Administration                      3,895                2,643                3,050                3,221                      –
Community & Culture                         184                   178                   251                   108                      –
Debt Services                      1,351                1,486                1,804                1,975                      –
Economic                         613                   539                   444                   705                      –
Education                      1,962                1,480                1,298                1,369                      –
Health                      1,884                1,830                1,363                1,595                      –
Law & Justice                      1,571                1,468                1,255                1,127                      –
Provinces                      5,224                4,247                4,453                4,157                      –
Transport                      2,003                1,221                1,001                   992                      –
Utilities                         338                   442                   241                   337                      –
Grand Total                    19,023              15,535              15,161              15,586                      –

5. Actually start reading some words!

The Foreword at the start of Volume 1 of the budget tends to include the key announcements and the budget “narrative” in only three or four pages – so much shorter than the typical waffle of the budget speech. It starts to become very interesting to compare the words in the foreword with the analysis of the tables covered in steps 1 to 4.

  1. Announcements.

Most of the big capital works programs should have been included in the 2018-2022 Medium Term Development Plan. So often the main announcements are actually around tax changes – and this often features in the write-up of the budget by the large accounting firms.

  1. Check on consistency between 2019 Budget and MTDP III

For the keen, you can attempt to compare the plans contained in MTDP III with some of the detail in the tables. The capital works programs contained in Volume 2 of MTDP III should match with the programs in Volume 3 of the 2019 Budget. A key issue is the link between the operational costs of the MTDP III and the 2019 Budget. This involves some hard work going through Volume 2 of the 2019 Budget which is huge – so large it has traditionally been printed in four separate volumes.

  1. Optimize food location

Stand close to the left hand side back door of the parliamentary lock-up when the nibblies come out – or at least that was the case several years ago. But possibly they have gone as a sign of budget austerity?

  1. Manage the volumes

The stack of budget volumes then somehow have to make it onto over-crowded library shelves. And on that note, if anyone has some old budget volumes (especially prior to 1990) which they not longer want to keep, please let me know! The only thing I like better than numbers is the history of numbers.

  1. Good luck and good night

Good luck! And I hope some of those hard-working PNG Treasury and National Planning Officers will be able to get some sleep with the 2019 Budget finally out of the way. Now just to get ready for the close of accounts, and then the process of monitoring. However, many in the private sector now have a long day ahead going through the numbers and reporting their analysis to their customers.

2018 MYEFO – Targets or Truth?

Executive Summary

PNG’s mid-year economic and budget update was released on 31 July. The summary snapshot presented by PNG Treasurer Charles Abel is “What this MYEFO is telling us is that the policies of the Government are working, the budget is back in control and the economy is improving.” (last line of Executive Summary p3). Unfortunately, the MYEFO reveals more a re-iteration of government targets rather than a true up-dated forecast of what is happening.

The key claims of the MYEFO are:

  • the deficit will be exactly the 2018 budget level of K1,987.2 million;
  • a small increase in expected revenues of K213.2 million driven by even further forecast increases in net GST collections (K112m) and mining and petroleum taxes (K142m – including K71m moneys directed through the Sovereign Wealth Fund);
  • this windfall revenue is then spent largely on increased wages for public servants and teachers (K233m);
  • public debt falls as a percent of GDP to 31.2% relative to the 2018 budget forecast of 32.2% (mainly as a result of a forecast increase in nominal GDP);
  • expectations of $US500m received from the Sovereign Bond in 2018 (up from $US200m as a first tranche in the 2018 Budget);
  • 2018 inflation forecasts have been reduced from 6.9% to 5.9% in 2018.
  • non-resource GDP growth being revised downwards in 2017 from 1.9% to only 0.2%, and in 2018 from 3.5% to 2.8%;
  • overall GDP growth rates are expected to increase from an average of 1.4% from 2019-22 to 3.5% (based on a change in forecasting methodology rather than better prospects) and relevant graphs do not include updated National Statistics Office figures for much lower growth than previously predicted by Treasury.

The good news from the MYEFO is that Treasurer Abel is clearly committed to the medium-term fiscal policies set out in 2018 – and on paper these look pretty good. The fact that the MYEFO is produced, and on time, is a positive indication of this element of economic governance structure remains in place. There is some acknowledgement that the PNG economy is performing poorly – there is more openness about this than revealed by Prime Minister O’Neill’s constantly up-beat comments.

However, there are also serious problems with this document. Details are provided below. In summary, revenue figures appear to be overstated significantly in key areas such as the GST by at least K200m even before considering GST refund games. No information is provided about the K800m assumed to be received from the National Fisheries Agency for 2018. There are repeated examples of where it seems IRC and Customs have been instructed to simply state a revenue target will be achieved, even when the underlying economic fundamentals have changed. On the expenditure side, the spending controls have focused almost entirely in the areas of the capital budget and concessional loan financing. PNG appears to be aiming for an expenditure target even when this will hurt its longer-term growth rate best illustrated by the poor take up of concessional financing (only 27% by 30 June). There is no transparency on expenditure arrears. There is confusion on the level of interest payments, with indications this may total over K2 billion in 2018. Domestic borrowing in the first 6 months of 2018 totalled K6,367.1 million, well above expected levels (so 61.3% of the total 2018 appropriation). Reliance on a Sovereign Bond to fix rollover risk appears to be a high risk strategy in the light of recent credit downgrades. Indications are that PNG borrowed some K480m extra in 2018 to pay expenditure arrears from 2017, casting even more doubt about the reliability of the 2017 Final Budget Outcome figures released in March.

There is no doubt that the new Treasurer is trying to improve PNG’s economic credibility. One way to do this is to continue claiming that the targets of the 100 Day Plan and the Alotau II accord are all on track. A better way is to be more transparent and truthful with what is going on and acknowledging that PNG needs some serious financial assistance to start turning around its poor economic performance. A deep hole has been dug by the O’Neill governments over the last six years and the path out is going to require more honesty and transparency than contained in this MYEFO.

Details

Revenue

Despite recent assurances from the IRC that revenues are on track, throughout the document there are clear indications that the revenue generating agencies are simply being obliged to meet 2018 revenue targets despite the PNG economy doing worse than expected. For example, despite an acknowledgement that dividend payments from the LNG project and mines will be lower in 2018, the MYEFO states “the Government is still requiring the full payment of budget dividends to the State in 2018” (p17). So Kumul Petroleum may need to borrow or draw on other reserves to match the 2018 dividend forecast despite the inevitable consequences of the massive earthquake in February. Another example is that the lifting of tax rates on over 900 tariff items in the 2018 budget was built into increased import tax forecasts for 2018. However, the impact of increased prices has had a much more dramatic impact on reducing imports than expected – which must be a real delight to domestic producers although not domestic consumers. Specifically, there has been a fall in import volumes of tobacco products by 44%, alcohol by 47% and refined petroleum by 61% between the first six months of 2017 and 2018 (p38). However, despite these extraordinary falls which would usually affect revenue forecasts, the MYEFO simply states “collections are expected to meet the annual projections” (p37).

The big revenue mover is claimed net GST collections. However, as argued in an earlier blog, it is a simple game available to IRC to delay valid GST refunds to PNG businesses to get a bigger number. By lifting the expected net GST figure by another K112.5m, the following graph indicates that GST collections are now expected to be 3.6% of non-resource GDP in 2018, a remarkable increase relative to the 2017 Budget predictions of 2.7% and earlier performance.

The government argues this is because of better resourcing etc to IRC. However, there is nothing that has changed that significantly in terms of IRC resourcing or commitment to compliance to justify such a large increase over the last 18 months. IRC has received better funding, a more flexible staffing structure and other support since 2012. It continues with its excellent leadership team that has always been committed to compliance and fairness and avoiding corruption – simply separating out the revenue components of the previous medium-term fiscal strategy does not make for such extraordinary turn-arounds. The figure on net GST collections would be much more credible if information was provided on levels of total GST collections as well as GST refunds – a very major item affecting budget bottom lines. Even then, for a flow tax such as GST (so its not lumpy like only a few payments a year such as company tax), it is reasonable to double the collections in the first six months to get a twelve month figure. Collections of net GST collections for the first six months of 2018 totalled K907.7m (Table 6 page 33). Total annual collections would reasonably be forecast to be double this or around K1,815.4m. This is some K160m below the budget forecast of K1,974.2m. However, this MYEFO, lifts this figure another K112.5m to K2,086.6m (all in Table 6). In addition to any GST refund games, based on collections by mid-year this estimate would seem to be high by around K270m.

The really big unknown on the revenue side is the over K2 billion in “Other revenue”. The MYEFO gives very little information on the implications of “sweep” – the collection of funds in accounts from various state entities. The key component are an extraordinary K800m in funds expected to be collected from the National Fisheries Agency – K400m in 2018 dividends and K400m in “Transfers not elsewhere classified” (details are provided on p 45 of the 2018 Budget Volume 1 – there are not similar details in the MYEFO). The press indicates K60m was paid in August 2017 but this is a very long way short of the K800m still in the MYEFO budget document. There is just silence on this major revenue item – and this seriously damages the credibility of the revenue forecasts.

The story about an increase in mining and petroleum taxes seems broadly plausible given lag effects (so much of the increase relates to high production in 2017). However, the increase of K142m is a long way below the absurd claims of a possible K1,500m windfall reportedly stated by Treasurer Abel in the press on July 19. The claimed increases in production levels following the earthquake are also considerably more optimistic than currently stated by private sector partners.

Expenditure

Expenditure control is being imposed on the capital budget while wage spending continues at above expected levels.

Overall expenditure levels are 41.4% of budget levels by 30 June. While this appears promising in keeping expenditure within the overall budget, the breakdown of where spending is being held back indicates PNG may be meeting a short-term target by cutting longer-term programs vital for lifting its growth rate and future revenues. Within this overall expenditure figure, the operational budget has spent 44.9% of appropriations, with Compensation of Employees (wages) running at 51.7%. In part this reflects a decision to make the 3% per annum wage increases for public servants and teachers in 2017 and 2018 which were not included in the 2018 budget. When the operational budget is out of control, it is questionable whether such payments should receive priority over other expenditure items.

Capital investment programs are running at only 21.4% of the budget. When going through the one list of projects that have received little funding (Table 22), one can better understand PNG’s budget pain and the challenges of fiscal adjustment. However, the table reveals that almost all projects were to receive K20m, K15m or K10m. Such rounded figures suggest that project identification processes are still weak with little accurate project forecasting.

At a high level, a similar disappointment is that concessional loan funding at 27.4% is at only about half the expected level. This is the cheap way to bring concessional loans into PNG. However, these require some counterpart funding, and the MYEFO acknowledges the “difficulties in providing project counterpart funding by Government that triggers loan disbursements”. This would seem a foolish way to cut expenditure.

In the expenditure detail, there are some extraordinary stories. The MYEFO Overview indicates the largest item of the K78.6m transfer between the operational and capital budgets is “District Support Grant program to specific 22 Districts in the Country totalling K55.0 million” p6. However, there is no further information made about this transfer, or how 22 Districts were chosen out of the 89 Districts in the country.

Payments from the Secretary’s Advance (Table 20 p60) once again makes for interesting reading.

A major expenditure issue is that of expenditure arrears – also discussed in this blog. No information has been given on the level of expenditure arrears, and how they have changed during the first six months of 2018. This is once again an area where not paying bills can make the budget look much better than it is. More transparency is required to improve credibility.

Interest costs have grown significantly in recent years. The 2018 budget started moving the overheads from loan borrowings (so fees for banks and agents) out of “interest” costs and into “goods and services”. This hides the full costs of PNG’s on-going annual loan borrowing. These additional costs appear to be very significant at over K200m – more than a full term of the tuition-fee free education policy. This is inferred from the difference between the interest expenses shown in some of the MYEFO tables of K1,864.7m and others indicating interest costs are now K2,092.1m (Table 19).

Financing

The 2018 budget financing strategy is increasingly reliant on the Sovereign Bond. There is now an expectation that the bond will generate $US500 million as a once-off financing mechanism in 2018 (rather than only $US200m in 2018). Given the recent downgrading of PNG’s credit standing by Moody’s and S&P in March, this would appear a high risk strategy. The Sovereign Bond has been a key claim in budgets for over five years now – and it just keeps being put off. Serious financing from an IMF structural loan package is a better and cheaper path for PNG, and would help provide some political coverage for the economic policy adjustments required on areas such as the exchange rate.

Domestic borrowing in the first 6 months of 2018 totalled 61.3% of the total 2018 appropriation of 10,388.5 million (so K6,367.1 million). This highlights the difficulties of getting non-domestic funding and the short-term nature of much of PNG’s debt. As Treasurer Abel has acknowledged, there is a serious issue is the structure of PNG’s debt portfolio.

Indications are that PNG borrowed some K488m extra in 2018 to pay expenditure arrears from 2017, casting even more doubt about the reliability of the 2017 Final Budget Outcome figures released in March. Specifically, total net borrowing totalled K812.9 million, although the deficit to 30 June was K324.9 million. As stated by MYEFO, “the difference (K488.0 million) attributed to the repayment of outstanding arrears from 2017, changes in the float at end year, as well as changes in cash balances”. No information was provided on the last two items – an area which also would benefit from improved transparency.


PNG’s 2017 Budget – Deficit at least K1 billion greater

Deputy Prime Minister and Treasurer Charles Abel’s credibility was on the line. Did he actually deliver on the 100 Day Plan promised reduction in PNG’s 2017 budget deficit from unsustainable levels?

The answer is almost certainly “no”. The actual 2017 budget deficit is conservatively estimated at over K1 billion larger than claimed – largely due to not paying bills or GST refunds. The conservative estimate would lift the size of the 2017 Budget deficit from 2.4% to just under 4% of GDP. However, the upper bound deficit estimate is K2 billion larger – or more than double – the K1.8 billion budget deficit reported in the 2017 FBO.

Even a 4% outcome would have better than the budget deficits of 2014 to 2016. However, the reductions were made in the wrong way. Expenditure was cut entirely in areas key for PNG’s future growth and concessional loan projects were delayed. Even using FBO figures, the blow-out in operating expenditures entirely consumed the claimed increase in revenues. This would have been bad enough. However, expenditure was likely K700m greater than revealed, and revenues likely K350m lower, meaning the operational side of the budget is not under control.

The following table summarises my best judgements on the likely impact of certain questionable elements of the FBO. There is a lot of detail in the previous two blogs which informs these judgements. Sometimes, the story is quite complex. The first column of numbers represents either figures derived from the FBO (4 items) as well as best estimates of expenditure arrears build-up and dividend shortfalls (2 items). However, given uncertainties and the lack of transparent information, I have also included a second column with a conservative estimate on likely impacts on the bottom line. Once again, this is based on judgements after having worked on budget documents over many years, and having some insights on what is possible. If I was just being suspicious about the figures in the FBO, I would be worried that the deficit would have blown out by over K2 billion. I am being conservative, and allowing for some administrative errors, it is almost certain that the deficit is at least K1 billion greater – so more likely K2.8 billion rather than K1.8 billion. Readers can make up their own minds, after hopefully being informed by the detailed analysis of the previous three blogs, of what numbers they consider should be in the right hand column. Of course, any increase in the deficit will eventually appear as higher debt levels and interest costs, assuming the government meets its legal obligations in contracts and legislation.

Summary of likely sources for understating the 2017 budget deficit

There is a legislative requirement to have a Final Budget Outcome (FBO) of the previous year by 31 March. This should be the authoritative statement of actual government revenues and expenditures. Having closely examined all the FBOs from 2010 to 2017 (and being involved in the preparation of the early ones), the 2017 FBO is the worst one yet.

One is left with a sense of unease. Some claimed cuts are just not believable such as the K535 million cut to education. The cut of K229 million to superannuation is also not credible. Games seem to have been made with trust accounts such as likely deferred payments of GST to Provinces of at least K200m. The large jump in GST collections is not credible – and can be explained by deferring GST refunds by at least K250m. There are clearly large expenditure arrears – the issue is acknowledged in the FBO but one needs to go to Parliamentary statements to get an idea of their magnitude (for example, the Public Works Minister has acknowledged arrears of K700m).

Ultimately, the final outcome is just too convenient. The Treasurer wanted a result no more than the promised 2.5% budget deficit in the 100 Day Plan and in his Supplementary Budget, and preferably something better. His Secretary delivered a deficit of 2.4%. The political convenience of the outcome combined with the games in under-reporting exporting and over-reporting revenues shown in the FBO indicate the deficit was adjusted downwards to hide the likely truth.

The Treasurer should have accepted the budget did not turn around as quickly as he had hoped, allowed a bit more time for correcting likely errors in a rushed report, and thereby maintained the previous levels of trust in a genuine, even if frank, Final Budget Outcome. However, it is still not clear that he understands the difficulty of turning around five years of poor fiscal management. The budget itself is not sufficiently transparent to deal with some key issues, especially around the level of expenditure arrears and GST refund delays. Including more information on these two critical areas in the forthcoming mid-year update (the MYEFO) would help restore some trust.

An implication of this analysis is that budget pressures will be greater in 2018. In the same way as a household which does not pay its bills on time, deferring expenditures and revenues simply builds pressure up the next year. The 2018 budget was already built on some dubious numbers – with expenditures and revenues well above the optimistic scenario by the IMF in its latest assessment. Adding at least another K1 billion to these pressures from expenditure and GST refund arrears highlights the challenge of PNG’s on-going high deficit levels.

Unfortunately, given the political situation, I do not expect the mid-year budget update due by the end of July (the MYEFO) to provide a more transparent or honest statement of the government’s actual fiscal position. One can no longer trust the government’s budget documents. PNG will likely go into APEC with many questions hanging over its true economic situation.

PNG’s 2017 Budget – Revenues – GST refund games and questionable dividends

Revenue Summary

This is the third blog examining the 2017 Final Budget Outcome (FBO) report released by Treasurer Abel. This blog examines the claimed revenue side of the 2017 budget. Overall, there is a likely overestimate of revenue in 2017 of K350m – and possibly up to K550m.

The 2017 Final Budget Outcome (FBO) claims domestic revenue has increased by K1bn relative to the 2016 budget, and matched the expectations of the 2017 Supplementary Budget. The big change was an increase in taxes on goods and services of K0.7bn, especially GST collections with a claimed increase of K0.4bn.

Unpacking these figures leads to some significant questions about the honesty of the FBO, especially on the GST side.

The best estimate of the underpayment of GST refunds is K350m – and such underpayments leads to the budget deficit being artificially lowered. A conservative estimate would be K250m. This is in addition to the K200m to K270m not transferred to the Provinces and likely held in the GST trust account until at least 1 January 2018 (mentioned in the previous blog).

The dividends figure is still subject to the concerns of previous dividend payments, especially from Kumul Petroleum from the PNG LNG equity. In 2016, the last available independent verification of these payments, the actual dividend was K100m not the K300m claimed in budget documents. This is because most of the dividends from Kumul Petroleum were simply “advances” according to the 2016 Extractive Industries Transparency Initiative report and confirmed by PNG Treasury. It is unclear when the previous “advances” will be repaid. Until there is a release of updated financial accounts (which were promised to be released by June 2018 under the 100 Day Plan), such dividend payments will hang under a trust cloud – so a likely false claim of K200m (in line with 2016 known data) and a conservative estimate of K100m.

GST Refund Games

First, why are there doubts about the large increase in GST revenues? GST is strongly connected to the health of the economy – especially sales. Reports from the business sector is that sales were flat in 2017, although there was an increase in imports. So does the jump in GST collections of K0.4 billion make economic sense?

The best figure for the GST tax base in PNG is non-resource GDP (as the resource sector is export-focused, it is generally exempt from GST). The following graph shows GST taxes (both to the national and provincial governments after refunds) as a share of non-resource GDP.

The green line indicates expected collections according to the 2017 budget. The expectation was that 2017 GST taxes would remain the same as a share of non-resource GDP at 2.6%, and then start increasing slowly over the next five years due to better administration, to reach 3% by 2022. The 2018 Budget included much more ambitious targets for GST collections – essentially expecting a 25% jump above the estimates from just a year before – shown by the blue line. This 25% jump was expected from 2018 –  a very short time-frame for lifting the whole process of better enforcement including business registrations. This was always going to be an unlikely jump as such changes usually build-up over years (still vital to do, but sequencing and timing matters). However, according to the 2017 FBO, this extraordinary 25% jump was able to occur between the 2018 budget delivered in November 2017 and 31 December 2017. This is shown by the red dot, with GST collections jumping from the 2017 2.6% figure included in the 2018 Budget to 3.3% included in the 2017 FBO.

Realistically, the only way for such a very large change to be possible in the last two months of the year is to play the game of deferring GST refunds. Tax compliance is possibly improving, but this is a slow process and had already received increased funding in previous years. Underlying economic health also did not suddenly improve – indeed, indications are that the economy was not doing well in 2017 such as the 3.4% fall in private sector credit.

The GST refunds game in 2017 requires working through a real puzzle. The complexity reflects the several components of GST and what appears to be a potentially new arrangement in 2017 that companies could reduce their company tax payments by directly claiming overdue GST refunds (an important cash management issue for many businesses). So patience is required in understanding the following detailed analysis!

The level of GST refunds is very large, so even minor games and delays can have significant impacts on budget bottom lines. Specifically, a large portion of GST collections need to be refunded – about 68% of net collections according to the Sir Nagora Bogan tax review (page 23 of its GST discussion paper at http://taxreview.gov.pg/wp-content/uploads/2015/09/15.09.17_issues.paper_.9_goods.services.tax_.pdf). 68% of net collections is just another way of saying refunds total some 40% of gross GST collections (so 1 – 1/1.68).

Let us run through a simplified example of how the GST system could have worked in 2017 based on ballpark figures contained in the FBO. On balance, the judgement is that this is the likely way the 2017 GST story unfolded.

Total GST collections could have amounted to K2.5bn – K1.25bn in collections from imported goods and services (ports collections are usually a bit over half of GST collections) and K1.25bn from sales within PNG (in-land collections). GST refunds would be expected of about K1 bn (40% of gross collections), leaving GST of K1.5bn (so K350m less than the FBO reported outcome). Of this total, the national government would receive all the ports collection share (so about K0.75bn). The provinces are due to receive 60% of land collections but this is lagged by two years so their 2017 payments are actually based on 2015 figures. Earlier budget papers indicate they are entitled to around K0.4bn in 2017, leaving the remainder of K0.35bn to the National Government. The national government would then receive a net K1.1bn (K0.75bn+K0.35bn).

The easiest way to increase GST receipts, especially at the national level, is to delay GST refunds. For example, a delay of GST refunds of K0.3 bn would flow entirely to the National Government in 2017, with some of this gain paid two years later to the provinces. In this context, some of the language of the 2018 budget is interesting – “up to end-October 2017 ….. actual refunds continued to remain low at below K200 million …. ” (page 28). Looking at relevant tables, the actual figure for refunds was K148m. This is a very low level relative to usual refund levels identified by the Bogan Tax Review – on 2016 collection levels, refunds of around K0.8 billion would have been expected by end-October – so about K0.65 billion less in GST refunds than expected.

Adding further complexity to this analysis is that companies could start claiming over-due GST refunds in 2017 – presumably an action by PNG’s Internal Revenue Commission to help with the cash flows of certain companies owed significant and over-due GST refunds. The 2018 budget stated “However, subsequent to the Supplementary Budget, revenue trends have continued to deteriorate particularly with further falls in company tax collections of around K351.4 million are now anticipated, although the GST offset impact is likely to mean that GST receipts will be higher by around K249.0 million.” (page 28).

This implies some K249m in GST refunds were being realised through the reductions in company taxes (and this should be offset through an increase in net GST collections as the GST refunds now appear as reduced company tax rather than reduced GST revenue). However, this does not clarify the level of previously outstanding GST refunds (possibly from 2016) or how much of the earlier K290m reduction in the Supplementary Budget estimate for company taxes was explained by GST refunds.

What does this all mean? The 2018 Budget figure of GST refunds being K0.65bn lower by end-October 2017 is a massive variation from the usual expected level of refunds. As company tax did fall by the K350m expected in the 2018 budget, it is reasonable to accept the PNG Treasury estimate that K250m of this was due to GST refunds (so 70%). In addition, the fall in company tax revenues between the 2017 Budget and the 2017 Supplementary Budget of K290m could also be 70% due to GST refunds – so say a further K200m (probably a very conservative assumption in the context of determining GST refund deferrals – it is not clear when GST offsets started being allowed in 2017 and most company tax revenues are later in the year). In total, allowing the K148m in refunds by mid-October to grow to K200m by the end of the year, and allowing a very high estimate of K450m in GST refund offsets through company tax, then total GST refunds in 2017 could have totalled around K650m. This is about K350m less than the usual pattern of GST refunds of K1bn mentioned by the Sir Nagora Tax Review.

Conveniently, if this was indeed the case, and K350m in GST refunds have been deferred until 2018 or later, then the level of GST collections increases from K1.5bn in the above example to K1.85bn – in line with the FBO outcome. This would explain most of the sudden jump in the above graph.

GST refund deferrals of K350m in 2017 fit very conveniently with the actual outcome. Being conservative, possibly these deferrals were only K250m. If gross GST collections were not doing well, reflecting continuing problems in the underlying economy, then the GST refund deferrals could have been considerably larger.

Future budget documents should be explicit about the level of GST refunds paid each year, as well as outstanding amounts. Such under-payments are almost identical to an expenditure arrear – a legally required payment that is deferred largely to suit the government’s cash flow position and rosy coloured budget reporting. Prior to introducing a more complete accrual budget reporting system, the budget should include explicit figures around GST refund levels and expenditure arrear levels to improve budget transparency.

Dividends or Advances? – K100m?

A feature of recent budgets has been the significant increase in expected dividends from statutory authorities. In previous years, there is growing evidence that some previously claimed “dividends” were not paid from profits and some payments were essentially loans. The clearest example is from Kumul Petroleum. In 2016, the last available independent verification of these payments, the actual dividend was K100m not the K300m (still) claimed in budget documents. This is because most of the dividends from Kumul Petroleum were simply “advances” according to the Extractive Industries Transparency Initiative report and confirmed by PNG Treasury. It is unclear when the previous “advances” will be repaid. Until there is a release of updated accounts, such dividend payments will hang under a trust cloud. In addition, the pressure on dividend payments from SOEs has been quite unrealistic in recent years, with reports that some SOEs are simply having to borrow funds to pay dividends. There is an urgent need to improve such transparency.

Point 19 of the government’s “100 Day Plan” states “Audited accounts for SOEs and Statutory Authorities for the last financial year to be produced and tabled in Parliament by June 2018”. Clearly, this timetable was not met, and raises further doubts about whether figures in budget documents can be trusted. Having these audited reports for 2017 could have removed this final element of doubt about the 2017 FBO. The O’Neill government is punishing itself with a lack of transparency.

The next article will bring together the analysis covering the “aggregate” view, as well as expenditure and revenue, to assess the likely real bottom line in the 2017 budget.

PNG’s 2017 Budget -Expenditure – Public servant’s missed superannuation payments, Provinces’ delayed GST, Education delays and increasing unpaid invoices

This is the second blog examining the very worrying 2017 Final Budget Outcome (FBO) report released by Treasurer Abel. This blog examines the claimed expenditure side of the 2017 budget. Overall, there is a likely underestimate of expenditures in 2017 of K700m.

  • • Superannuation underpayments of up to K229m – conservative estimate of K150m;
    • A likely non-payment of GST revenues to the provinces of up to K270m – conservative estimate of K200m;
    • A claimed but unlikely cut in education spending of up to K534.9m – conservative estimate of K100m;
    • An unknown level of expenditure arrears – the Public Works Minister told Parliament there were some K700m in unpaid bills in his portfolio alone (presumably built up over a couple of years). A broad estimate is made of a possible overall build-up in expenditure arrears of up to K500m in 2017 – a conservative estimate of K250m;
    • The two largest areas of expenditure increase between the 2017 Budget and the 2017 FBO are in undesirable areas – an increase in debt service costs of K251m and in administrative expenses of K316m;
    • Analysing expenditure trends was complicated as the FBO uses four different measures of government expenditure instead of the usual two. Its sectoral analysis is also inconsistent with the 2018 Budget.

Details for each of these items are provided below.

Superannuation payments – a K229m deferral or error?

Table 11 indicates that Employer’s Social Security Contributions were K441.8m in 2016 (and K330.8m in 2015 from Table 13A of the 2018 Budget). The 2017 Supplementary Budget indicated the outcome was expected to be K404.2m in 2017 – so a cut of 10% relative t o2016. However, the FBO indicates superannuation payments were only K175.2m, a cut of K229m from the 2017 Supplementary Budget. This represents one of the major areas of “expenditure saving” in the 2017 FBO. Clearly, it is at best just a cash deferral of a legal obligation to make payments, and will simply build up superannuation arrears.

Just to check the likely deferral of superannuation funding for public servants, it is noted that the 2018 budget provides K387.1m for such payments – so the K175.2m is either a definite underpayment or an error in the tables. Indeed, the FBO figure is even less than the claimed “automation payment” of K180m in 2017. The text of the FBO (page 22) claims “In 2017, the Government budgeted K90.0 million for exit payments owed to NSL. This enabled the Government to complete the reimbursements it owed to NSL for payments it made on behalf of the State to exiting members. It was also used to make payments directly to exiting members through NSL.” However, the FBO indicates these exit payments were not made.

One would have expected a stronger public reaction if this was the case. The most likely explanation is that at least some of these payments have been made, but they have not been recorded as expenditure in the FBO. Once again, this would understate expenditure and the actual size of the deficit. A conservative estimate is that there has been a deferral of superannuation payments of K150m.

GST Payments to the Provinces – under-funding by K200 to K270 million.

This one took some detective work and reflects the lack of clarity from using different expenditure figures.

Table 5 in the FBO provides revenue figures inclusive of GST and Bookmaker’s Turnover Tax revenues which are then transferred to the Provinces. The footnote to Table 5 indicates the GST gross collections figure includes K294m held in trust. It also indicates that GST transfers to the Provinces should total K450m.

Bookmaker’s Turnover Tax is relatively small at K36m in 2017 – so it is a relatively minor issue relative to GST.

Table 9 in the FBO also shows expenditure inclusive of these GST and Turnover Tax transfers. However, Table 20 shows expenditure exclusive of these GST and Turnover Tax Transfers. The difference in totals between Table 9 and Table 20 should thus indicate the level of GST and Bookmaker’s Turnover Tax to Provinces. Sounds simple.

The difference in expenditures in these two tables were close to the expected GST transfers for the 2017 Budget and the 2017 Supplementary Budget (K380m). So this was the expected level of transfers of GST to the Province.

But the 2017 FBO outcome shows a difference of only K180m. So what does this mean? As the only difference between these two expenditure results is supposed to be GST and Bookmaker’s Turnover Tax transfers to the Provinces, there appears to be K200m not transferred and not recorded as actual expenditure.

This K200m difference is actually close to the level of funds included in the GST Trust account mentioned above of K294m. It is even closer to the Table 5 footnote reference that K450m should be transferred to the Provinces, but only K180m actually was transferred – so a difference of some K270m.

It would seem that GST gross tax collections have been recorded on the revenue side, but only part of the required transfers recorded on the expenditure side. These funds were still held in the GST Trust account (there was no mention of such a balance in the 2016 FBO), thereby understating expenditure and the actual size of the deficit by between K200m and K270m.

Education – unlikely claimed cut of K534.9m?

Table 20 of the FBO provides Government of PNG funded expenditure by sectors (so it excludes donor funding). The movements for each sector between the 2017 Budget and the FBO are shown in the following graph.

The cut in Provincial funding largely reflects the decision to only around 20% of the various Service Improvement Programs to districts and provinces. This was the major saving item in the 2017 Supplementary Budget. Of course, it was politically sensitive, and the Prime Minister objected, so it actually wasn’t even mentioned in Treasurer Abel’s 2017 Supplementary Budget speech.

However, the cut of K534.9 million shown in Table 20 of the FBO between the 2017 Budget and the 2017 FBO is extremely confusing. Such a large cut seems unlikely but it is necessary to get to the bottom expenditure line of Table 20 – and thus the claims and credibility of the FBO. Possibly, some education expenditure was placed in the “Miscellaneous” category, but this does not match the movements in this category (ie it didn’t go up by an off-setting K522m as part of the Supplementary Budget).

The more likely explanation is that the Tuition Fee Free Education payments are made through a trust account. Whenever you see “trust account”, there is great scope to vary the timing of cash payments. The original budget for such payments was K602m. There were many reports well into 2018 that schools had not been paid all their TFF payments for 2017, although there were also reports that most schools had received at least two of their four payments.

One is left uncertain as to what is going on here. This is a very major indicated cut – nearly 5% of the entire budget. Almost certainly, a significant portion of TTF payments were made, but a significant proportion were not paid. There is scope for cutting back on other education payments (universities seemed unhappy with the gap between the promised budget and fund received in 2017). However, it is impossible to tell how much of this represents an actual cut in 2017 expenditure.

Given the widespread reports of delays in payments of the TTF, as well as underfunding for universities, a conservative estimate is that K100m of this K522m saving represents a deferral of education expenditure until 2018.

On the positive side, there were increases in areas such as health, as well as law and justice. At least this represents a small claw-back from the massive cuts since 2014.

On the negative side, the biggest areas of increase are in debt services and administration – undesirable areas of growth. There are some signs that the government is taking some action on the administrative costs blow-out. Experience with reform efforts in the mid-2000s, such as rationalising the size and number of public service agencies, indicates how difficult it is to deal with entrenched bureaucratic interests. The expansion of teaching salaries seems inevitable, both in terms of the number of teachers required to deal with increased school enrolments, as well as delivering some long-overdue pay rises. Rationalising the number of government agencies is potentially complicated by the linked interests of Ministers in having a separate department and the political pressure to have lots of Ministers.

Expenditure arrears – K250m to K500m

Budget documents make it very clear that there are large expenditure arrears by the PNG government. However, there is little information on the actual level of these arrears.

The simplest way to reduce expenditure is not pay bills, even when services have been provided. These arrears are unquestionably very substantial. For example, the Minister for Public Works recently told parliament that his agency had K700m in unpaid bills. The Port Moresby Chamber of Commerce and Industry recently lobbied the Treasurer about the documented over K290m unpaid bills owed to its members. This is a very significant level of arrears.  Growing frustration with this issue suggests these arrears continued to build during 2017.

Even the 2018 Budget states on p94 “Subsequent to the 2017 Supplementary Budget, revenue trends have continued to weaken and, although expenditures have been contained somewhat, arrears have continued to mount”. Given even the two examples provided total some K1 billion in arrears, it is possible the figure is double that. Assuming a 25% increase in the level of arrears in 2017, the implied figure is around an increase of K500m in 2017. Being conservative, this figure is halved to estimate an increase in expenditure arrears of K250m.

Overall, the expenditure side of the 2017 FBO underestimates actual expenditure liabilities by K700m based on a conservative estimate. The upper range is the 2017 FBO underestimates expenditure by slightly over K1.5 billion.

Such expenditure under-reporting seriously damages the credibility of the 2017 FBO by Treasurer Abel. PNG’s budgetary position is likely to be significantly worse than officially reported.

The next blog will explore the revenue side of the budget before a final blog making an overall assessment.

PNG’s 2017 Budget – delaying cheap loans from ADB and World Bank

The O’Neill/Abel government continues to refer how new loans from the ADB and World Bank will help with PNG’s budget and foreign exchange problems. But why did they let K418 million in cheap loans slip through their fingers, especially on good projects already approved under PNG’s planning processes?

This is one of many questions raised by Treasurer Abel’s 2017 Final Budget Outcome (FBO) report. The 2017 FBO is a fascinating and worrying report – one that was clearly rushed given the number of errors in the document. This is the first of four blogs that will closely examine the document, its strengths and its weaknesses.

For those not wanting to wait to read through to the end of the four blogs, the conservative estimate is that the 2017 deficit is at least K1 billion greater than claimed by the 2017 FBO.

This blog will look at the “aggregate” view of the FBO, the second will focus on expenditure, the third on revenue, and fourth will make an overall assessment.

Aggregate Perspective

When looking at claimed total levels of government expenditure and revenue, it is interesting that the 2017 Budget outcomes matched that of Abel’s predecessor, now Opposition Leader Patrick Pruaitch, rather than the figures contained in the 2017 Supplementary Budget much trumpeted by the new Treasurer.

Specifically, total revenue estimates were K11.5bn in the Pruaitch 2017 Budget, 11.0bn in the Abel Supplementary Budget and the 2017 FBO outcome was K11.5bn.

On expenditure, total expenditure estimates were K13.3bn in the Pruaitch 2017 Budget, K12.9bn in the Abel Supplementary Budget and the 2017 FBO outcome was K13.3bn.

At an aggregate level, former Treasurer and now Opposition Leader Patrick Pruaitch was more accurate than the current Treasurer Charles Abel.

However, the movement in these aggregate figures mask a significant shift between domestic and donor funding. Increased donor funding was K471.8m between the Supplementary Budget and the 2017 FBO. Some would say this reflected a shift to increased aid dependency. Possibly it just reflected a more accurate prediction of donor flows.

On domestic revenues and expenditures, the Supplementary Budget was close to FBO figures.

Aggregate Perspective – Changes from 2016 to 2017

The 2017 FBO provides some interesting information on what happened in the budget between 2016 and the claimed results for 2017.

At an aggregate level, comparing 2016 outcomes to claimed 2017 outcomes, revenues have increased by about K1 billion. All of this has been absorbed by an increase in operational expenditure of K1 billion. However, there have been reductions of K908 million in capital expenditure and K418 million in the use of concessional loan projects – both undesirable but “easy” ways to cut a budget.

These cuts in longer-term investments are K263 million greater than the operational expenditure blowout, and when combined with revenue increases, the budget deficit is claimed to fall by K1.3 billion.

The following graph provides a break-down of key movements in budget aggregates between the claims of the 2017 FBO and 2016 outcomes.

Between 2016 and 2017, ‘Tax Revenue’ increased by a claimed K720m, ‘Other Revenue’ by K310m and Donor Grants by K10m for a total increase of K1,040m.

All of this revenue increase has been absorbed by an increase in operational expenditure of K1,053m.

However, there have been reductions of K908m in capital expenditure and K418m in the use of concessional loan projects. These are both undesirable but “easy” ways to cut a budget.

These cuts in longer-term investments total K1,326m and fully explain the claimed fall in the budget deficit  by K1,302m.

Frankly, this is not the type of structural improvement one is looking for when lowering the deficit. Having all of the reduction based around capital expenditure is of concern as it lowers (assuming the funds where well spent on roads etc) PNG’s future growth potential.

Of particular concern is the cut in concessional loan expenditures of K418m. This is likely to be funding from sources such as the World Bank and Asian Development Bank. Such programs are cheap – interest rates of 2 to 4 per cent are much lower than the costs of borrowing on from PNG’s domestic finance markets (where rates are 8 per cent for one year Government Bonds and around 12 per cent for longer-term Treasury Inscribed Stock) or any possible Sovereign Bond. They are also programs that have generally gone through strong and transparent project design and contracting methods.

This appears a sub-optimal policy. This is the type of financing sources that PNG should be seeking to increase rather than cut as they did in 2017. It was important to reduce the historically high budget deficits of recent years. However, doing this by slashing infrastructure programs and giving up concessional loans is difficult to explain.

The next blog will examine in closer detail why government expenditure (or at least build-up in liabilities) is likely to be considerably greater than claimed by the FBO. The following blog will then examine why revenues are also likely to be lower. The fourth and final blog examining the FBO will then assess the likely actual outcome for budget policy in 2017. For those not wanting to wait to read through to the end of the book, the conservative estimate is that the 2017 deficit is at least K1 billion greater than claimed by the 2017 FBO, with an upper estimate of a K2 billion understatement of the size of the budget deficit.