Earlier articles have covered the facts around the corruption of PNG’s GDP statistics and found a false alibi for this economic crime. So what are there possible motives? Four motives are explained below.
The first and primary political motive is the inconvenient fact that the updated PNG National Statistical Office (NSO) figures, supported by the Australian Bureau of Statistics and the IMF, show the non-resource parts of the economy had been in recession in 2015 and 2016. As well over 90% of the PNG population derive their livelihoods from the non-resource sector (especially agriculture), it is vital to focus on the non-resource sector when determining how things are actually going for the people of PNG. So a recession extending over both 2015 and 2016 in the non-resource sector is a major issue, including a political one. While much of the economic decline was the inevitable end of the construction phase of the PNG LNG project, admitting a severe recession extending over two years would hurt the government’s economic credentials and leave it open to further charges of economic mismanagement.
Second, economic growth rates have become a political issue in PNG – the Opposition is calling for a commitment to move to a 5% non-resource GDP growth target. One easy way to manage such a call is to take control of the growth statistics and simply boost them up.
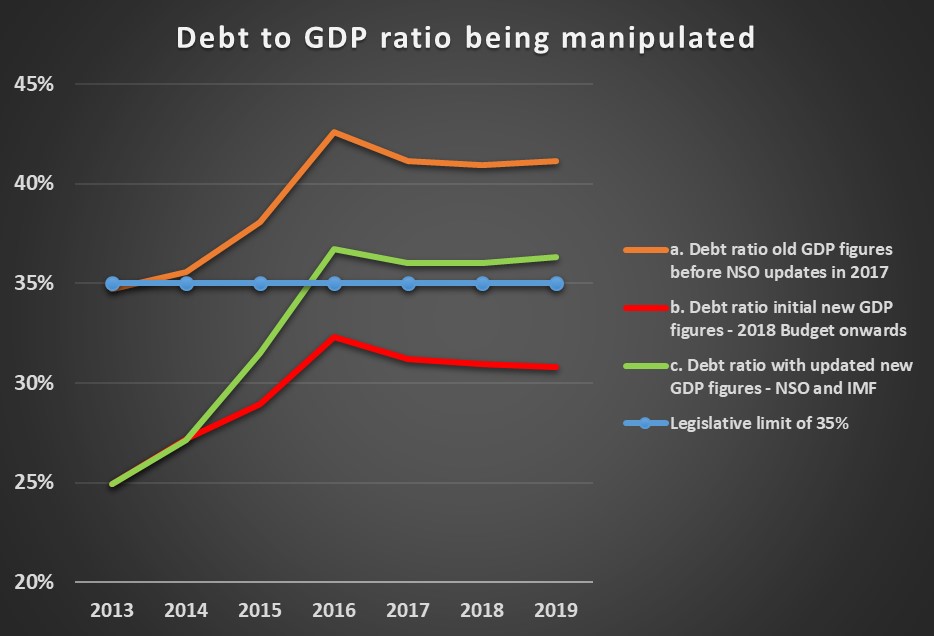
Third, there are more subtle impacts from using a higher GDP number, even if a fraudulent one. This is illustrated in the following chart. The chart uses official GDP debt levels contained in the 2019 and earlier budgets for all three lines – so the only variation is disagreement about GDP levels. The top orange line shows the situation using the original PNG Treasury numbers – so before the 2017 NSO update. Projected debt levels were going to keep the debt to GDP ratio above the limit set in the law of 35% (under the Fiscal Responsibility Act). This would have been politically embarrassing. Holding the debt to GDP down would have required a lower budget deficit, requiring less spending or more taxes. Since the 2017 election, there has been little appetite for constraining expenditure – there have been very large increases in expenditure in Treasurer Abel’s first and second budgets.

With the initial 2017 NSO update, PNG’s debt to GDP ratio almost magically resolved itself, falling to the red line. Lifting the nominal GDP figures means the debt to GDP ratio decreases – one is dividing by a bigger GDP number which allows for more debt at any particular ratio. There was now the option to spend more without breaking or amending the law. This was a very convenient solution for the government and avoided immediate pressure on the PNG Treasury to cook the GDP books – they could use the NSO figures up to 2014 and then grow GDP forward at reasonable rates to solve the debt to GDP – shown by the red line.
However, the subsequent March 2018 figures from the NSO put an end to this easy solution – with the new situation shown by the green line. The new figures for 2015 lifted the debt to GDP ratio from 29% to 32%. But an even greater worry was that the lower base and realistic growth rates meant that from 2016 onwards that the government had been breaking the law with a debt to GDP ratio exceeding the 35% limit. Although the government has the numbers to simply lift the ratio higher, this could reflect poorly on its international reputation. It could also lead to calls for better indicators for debt fragility such as looking at debt interest costs to revenue ratios (PNG’s are very high for developing countries while its debt to GDP ratio is relatively low).
In summary, the orange line was a problem. The red line was an initial solution – both more accurate figures from the NSO/ABS/IMF, and very convenient for dealing with the debt to GDP ratio. The new green line is now the problem – the updated figures from NSO continued to be accurate, but they were no longer politically convenient.
Fourth, higher nominal GDP figures have other indirect gains. In the same way as they lower the debt to GDP ratio, they also lower the budget deficit to GDP ratio. This gives the impression the budget is more under control. The GDP ratios can also be useful when making historic comparisons to economic performance prior to 2006. This is because the NSO update in 2017 lifted the nominal level of GDP by nearly 50% for 2006 and at least 30% through to 2014. However, it didn’t update its pre-2006 numbers. So debt to GDP and deficit to GDP figures look much, much worse in the times prior to 2006 simply because GDP estimates have not been updated, and this helps make the current government look better. Higher GDP figures are also likely to feed into higher estimates of government revenues as many GDP elements such as wages and profits and consumption are directly linked to tax collections.
Conclusion
Pushing the 2018 NSO/ABS update off to a committee and using the government’s own GDP numbers is hard to interpret as anything other than corruption of PNG’s most basic economic measure. The ABS appears to have walked away from the issue – an understandable response to help protect its professional integrity.
The final sentence in the “explanation” for the difference in GDP figures (discussed in the third article in this series) concludes:
“In the meantime, all stakeholders including donors are urged to use official estimates of the National Accounts produced by Treasury especially for the years 2015 to the current year and until the new 2015 National Accounts are released.”
Hopefully, this will not be done. There is a pretty clear truthful statistic for nominal GDP in 2015 – and that is not the one being used by the PNG government. There are very limited channels to try and limit the level of growing political corruption in PNG. There was a chance to make a more forthright set of comments about the 2017 election, but Australia clearly failed in that area.
Hopefully other donors can follow the lead of the IMF and other independent commentators in not simply accepting the economic narrative from the PNG government which is increasingly being based on manipulated economic and budgetary statistics. PNG’s institutions will struggle to turn the economy around when it is so far off course and its economic compass of genuine statistics has been so seriously corrupted.


2 thoughts on “The motives: Why would the O’Neill/Abel government want to manipulate economic statistics (4)”
Comments are closed.