This is the second of a four part series covering the corruption of PNG’s economic statistics. A summary of the analysis was released yesterday. This section covers in detail the facts around the corruption of PNG’s estimates of Gross Domestic Product (GDP) – the measure of the size of the economy. Tomorrow’s section will cover the government’s false alibi, and the final section will cover the government’s motives for this economic crime.
The following graph provides the latest economic forecasts of GDP by the PNG Government (sourced from the 2018 and 2019 Budget documents), the National Statistics Office (for 2013, 2014 and 2015) and the International Monetary Fund (from its latest economic survey of the PNG economy published just last month).
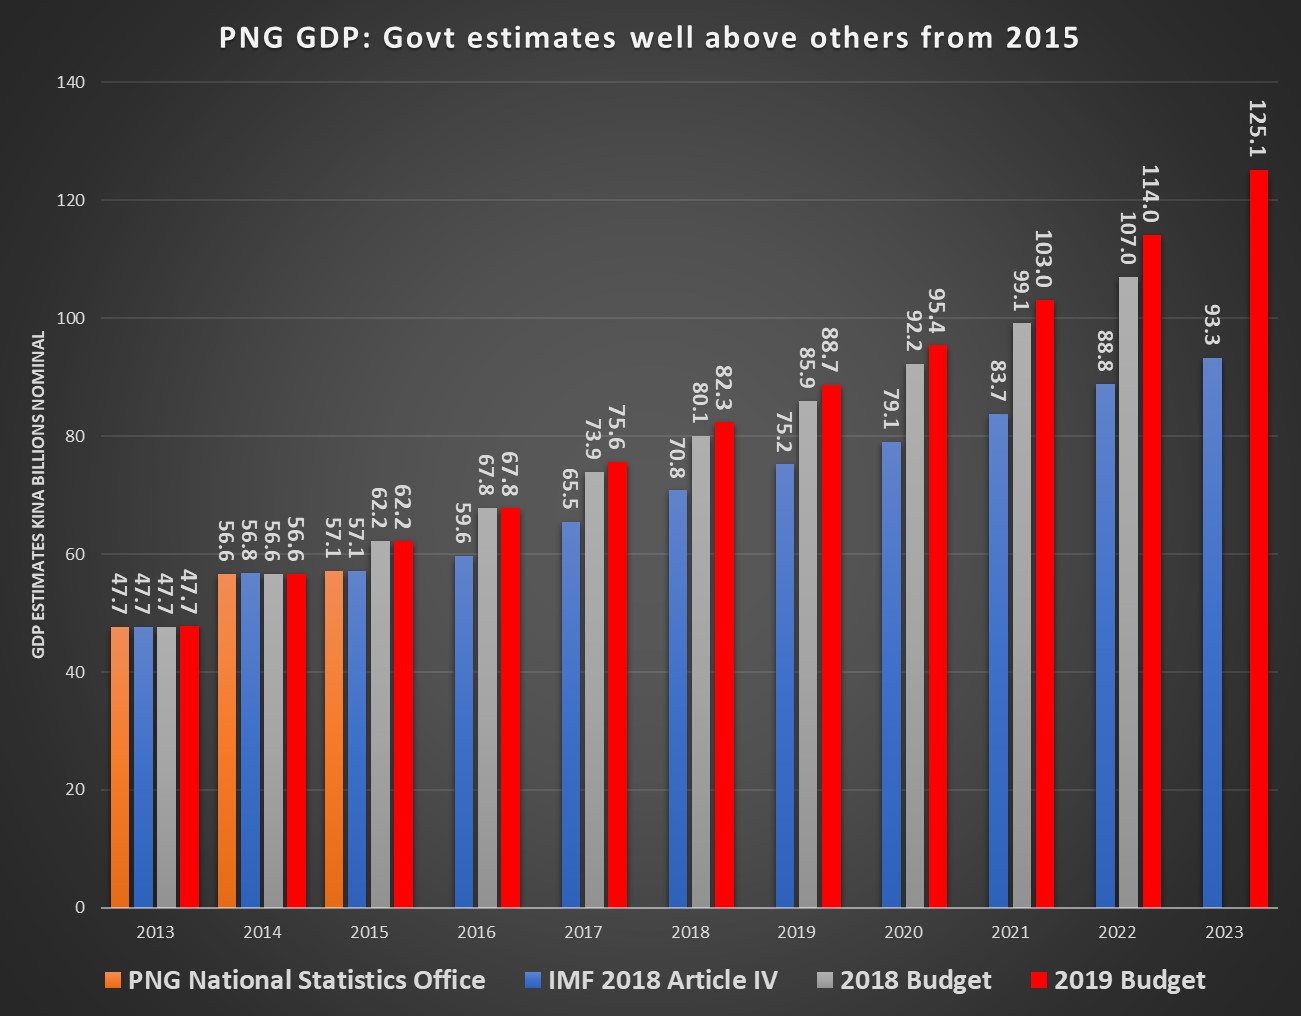
There are several features of these figures.
Historical agreement
There is complete agreement on GPD measures from 2007 to 2014 estimates – so although the graph only shows from 2013 onwards, the agreement goes back to 2007. The NSO produced in 2017 up-dated GDP reports covering the period from 2007 to 2014 for all sections of the economy providing nominal estimates, and relevant price indexes to determine real growth patterns (an earlier release covered the period 2006 to 2013 but didn’t include price indexes). The PNG Treasury and BPNG fully agreed with the NSO’s update of GDP statistics from 2007 to 2014 including the new price indexes (this is an important fact for the next article covering the government’s “alibi”). This NSO work was important for understanding the actual performance of the PNG economy. The NSO’s economic section had not produced any GDP figures since 2006 – bad for economic policy in PNG and in breach of PNG’s formal obligations for being a member of organisations such as the World Bank. Fortunately, back in 2016, the NSO agreed to partner with the Australian Bureau of Statistics (ABS) and the IMF to start producing this most basic economic statistic once again . This new collaboration also allowed better methodologies to be used. With the agreement from all for the figures from 2007 to 2014, things were once again on track and going well.
The 2015 divergence
The columns only begin to diverge in 2015. The NSO released a report on the measure of GDP for 2015 on 9 March 2018. This NSO report calculated nominal GDP had grown by 0.7% in 2015, well below the 9.8% estimated by PNG Treasury. The NSO’s lower figures were no surprise. Other economic measures clearly indicated PNG’s non-resource sector was in recession in 2015 – PNG was in its worst drought since 1997 which was hurting both the agriculture and mining sectors; businesses were reporting sales down 10 to 20%; employment levels were dropping; tax collections from wages and profits were in decline; and the value of imports was plummeting to levels of a decade earlier.
The graph indicates the IMF accepted the new NSO figures for 2015. However, the PNG Treasury broke with tradition and refused to accept the NSO numbers. They refused for the MYEFO update in July 2018 (without explanation), the 2019 Budget Strategy in September 2018 (without explanation), and in the 2019 Budget itself (with an unbelievable explanation discussed in the next article). The Treasury is still claiming the economy is 9% larger in 2015 than its own NSO office, with the assistance of the ABS and IMF, has calculated. The next article will cover the ABS recently walking away from this mess.
Growing divergence from 2016
There are no publicly available official numbers from the NSO after 2015 – although they had apparently nearly completed the 2016 update (the IMF reports the figures had been “drafted but not published”). The IMF would have had access to the NSO’s /ABS’s 2016 estimates, and it is likely they are included in the IMF figures. Once again, PNG’s non-resource sectors (which include agriculture, construction, wholesale and retail trade, finance, government, community services, transport, communications – so the vast majority of the economy on which the economic welfare of PNG citizens depend) is estimated to have been in a mild recession in 2016 with a negative growth rate of -0.1%. Building on a non-resource recession in 2015 with a negative growth rate of -3.1%, this was clearly going to be embarrassing for the O’Neill government, highlighting that it had not put in place a continued growth strategy following the inevitable end of the PNG LNG construction phase. The government’s response was that in addition to the 9% over-estimate in 2015, another 5% over-estimate was added in 2016 – lifting the overall gap between the government’s figures and the IMF (likely NSO/ABS figures) to 14%.
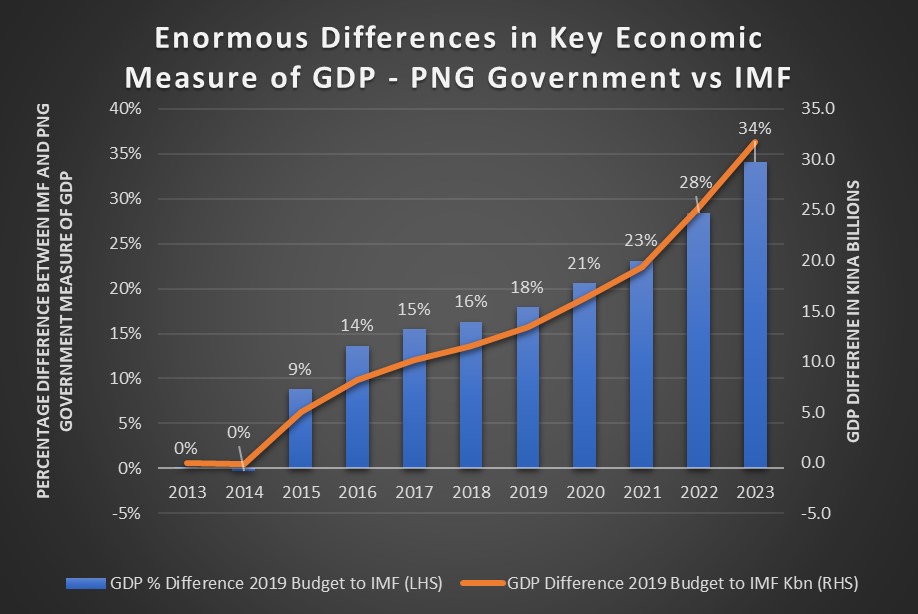
The gap continues to grow as the PNG Treasury has also broken with tradition and is now including into its forecasts assumptions that particular resource projects will go ahead even prior to a final investment decision being made. Such an approach is known to be dangerous – it is called the “presource curse” (see here) where assumptions about unconfirmed future resource projects are built into government models, thereby generating assumptions about increased revenues, which are then often spent. This phenomena is also known colloquially as “counting the chickens before the eggs are hatched”. The O’Neill/Abel government is also forecasting very, very strong economic growth rates in future years. For example, for 2022, the IMF estimates growth will be 3.3% in real terms for the non-resource economy. This is the same figure used by the PNG Treasury in the 2018 Budget. 10 months later, the PNG government forecast the growth rate would be more than double this rate at 6.9%. Only two months later, the government’s growth rate forecast increased even further to an extraordinary 9.7% – nearly triple the IMF rate and triple the rate included in the 2018 Budget of Treasurer Abel.
These assumptions about much higher growth rates build on the earlier “base” issues for 2015 and 2016. By 2023, the difference between the O’Neill/Abel 2019 Budget estimates and those of the IMF have risen to K31.8 billion, or 34% of the economy. The build-up of these differences is shown in the graph below, with the percentage gap shown in the blue columns and left-hand axis (identical to the graph shown in the executive summary) and the gap in Kina billions shown in the orange line relative to the right-hand axis.
Conclusion
Such massive differences in understanding how the economy is performing is not just a simple difference in statistics. Good statistics can help better understand what is going on, and possible good policy options – they provide an economic compass. For example, by acknowledging the economy was really struggling in 2015 and 2016 might have encouraged a faster response in dealing with the 2015 drought as well as earlier action to correct the foreign exchange problems. There were other indicators of these problems, but admitting that there is an actual economic recession can galvanise government action faster and in a more focused way. Unfortunately, PNG has thrown away its economic compass. Without a good compass, it will be much harder for PNG to turn the economy around from current mismanagement. And as poor economic management costs lives through lower wages, higher prices, and fewer basic services, such a blatant corruption of the figures is an economic crime.
One thought on “PNG’s GDP facts – the economic corruption (2)”
Comments are closed.