
This is the third post on economic issues at the Australia PNG Business Forum held in Cairns in May 2016.
Unfortunately, I missed the Governor Loi Bakani’s presentation at the Forum as I was operating my stall outside the conference room promoting PNG Economics. It is now available here. If I was in the room, I would have been surprised at the political nature of the presentation – it is very different from the tone and coverage of previous ones such as last August’s PNG Advantage Investment Summit in Brisbane (available here). I support the view that in times of economic crisis, it is appropriate for senior figures such as the head of Treasury and the Governor of the Central Bank to become more engaged in debates to help build confidence (I witnessed this first hand during the Global Financial Crisis as head of the Australian Treasury’s International Finance and Development Division from 2011 to 2013). As I’ve made clear to the Governor previously, I believe an open debate about economic policies, based on facts, strengthens democracy. Being aware of and acknowledging a problem is the first step in finding a solution – and such a process can build business confidence.
Key points
- The recent massive upward revision to the 2006 GDP estimates by 48%, and the lesser increase of 35% in the 2013 GDP estimates do indeed have important policy implications.
- These are major changes in numbers and should be verified (preferably by the IMF) as part of their next visit to PNG.
- It is unusual to criticise people for using what were previously the official statistics from PNG Treasury and, indeed, BPNG itself.
- Four days before the Cairns presentation, the Governor released the BPNG December Quarterly Bulletin which stated “The public debt to GDP ratio is projected to increase to 35.8 percent, exceeding the Government’s target of 35.0 percent as it resorts to external borrowing to partly retire domestic debt. p 26.”
- This is an example of the politicisation of the speech. Attacking “critics” for using old numbers really is tough when they were using the Governor’s own numbers only four days earlier.
- At the time the PNG Budget was passed, the government’s own budget documents also indicated the expectation that the legislative limits on government debt would be exceeded (see Table 27 of Budget Volume 1 p78).
- That was at least the intent of policy, even if the goalposts have now been so conveniently shifted.
- But as discussed earlier (see here) the issue is not so much the level of debt. PNG has a relatively low measured debt level even using the old GDP numbers if the measure is narrowly limited to official public debt and excludes other off-budget loans. However, debt risks are now significant because of concerns about financial liquidity to pay interest and rollover debt.
- This is linked to the recent down grading of PNG’s credit rating by international agencies.
- Breaking the legislative limits is not a major issue as the government simply could have changed the legislation (as it did in 2012 to deal with the growing debt levels).
- The Governor provides new GDP figures not even available on the National Statistics Office (NSO) website.
- The GDP revisions by the NSO stop in 2013 (see here) – no public available estimates for 2014 to 2016 were available prior to the Governor’s speech.
- [The final sentence in this section was in the original blog post. However, on checking again I acknowledge that I made an error in not including the “Taxes less Subsidies on Products” line which reconciles Gross Value Added at Basic Prices to Gross Domestic Product. The Governor’s figures for the years 2010 to 2013 do match the NSO publication. I apologise for this error. All other elements of the original analysis stand. I have also added the Governor’s comments on the official debt levels in the December Quarterly Economics Bulletin above. Last sentence which should have been excluded: “However, the figures used in the presentation do not match those which are available from the Statistics Office – 3.2% higher in 2010 through to 3.9% higher in 2013.”]
- The Governor’s figures on new GDP nominal growth rates (using the previously unpublished NSO information) indicates growth estimates are 12.6 % lower from 2013 to 2016 relative to the estimates by PNG Treasury in the 2016 Budget
- They are 0.6% lower in 2013, 6.1% lower in 2014, 4.2% lower in 2015 and significantly, the 2016 growth rate estimate has been lowered by 1.6%.
- They are now close to IMF estimates of nominal growth rates.
- The NSO information included no information on real changes – this was listed as work to be completed by late 2016 (and now appears to have been brought forward for some reason).
- They are 0.6% lower in 2013, 6.1% lower in 2014, 4.2% lower in 2015 and significantly, the 2016 growth rate estimate has been lowered by 1.6%.
- The Governor’s graph on key expenditure titled “Increased expenditure on key enablers” actually shows that 2015 expenditure is lower than 2011 for health, education, transport and infrastructure (and that is not even allowing for inflation). Frankly, it is hard to reconcile this with the claim that key government priority sectors have been protected.
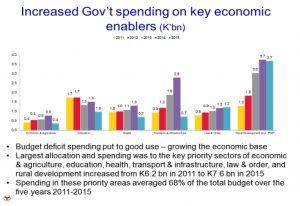
- The 2016 Budget slashes these key areas even further – see here.
- Stated fiscal policy is too harsh and hitting the wrong sectors – the cutbacks are more severe than those imposed on Greece even though PNG’s situation is not currently as bad.
- The Governor’s graph highlights the enormous growth in DSIP, PSIP and other sub-national funding (titled “rural development”) – at this stage, the success of this major decentralisation program is best described as “mixed” as indicated by a number of the presentations at the February Leaders Conference in Port Moresby.
- The growth in spending on “law and order” is welcome – and it is important that the increased resources available to the police are best utilised for defending the people of PNG and their democratic systems.
- PNG’s budget deficits are very high although they are reducing from their peak in 2013.
- PNG Treasury’s estimates of deficits shown in the 2016 Budget (page 118 of Table 10 (II) with latter years shown also in Table 1 on page 26) were as follows: 9.6% of GDP in 2013, 8.3% in 2014, 4.9% in 2015 (revised to 5.0% in the FBO although using a different GFS) and 3.8% in 2016. It is not clear why the Governor uses different figures from the PNG Treasury estimates.
- Using the new GDP numbers, these ratios move to deficits relative to GDP of 6.9% in 2013, 6.3% in 2014, 3.9% in 2015 and an estimated 3.1% in 2016.
- These are still very high deficits. It is now difficult to compare these deficit levels with previous years as GDP for years prior to 2006 are also likely to be much higher than earlier estimates (which means the ratio of deficit to GDP is lower). Even without making adjustments to earlier years, PNG’s “new” combined budget deficits from 2013 to 2016 of 20.2% are the largest in its history (exceeding the 16.9% figure from 1980 to 1983, the 19.3% figure in 1990 to 93, and the 12.9% figure from 2000 to 03 – each of which represented a significant fiscal crisis in PNG’s past).
- Lessons do not appear to have been learnt – even using the new GDP numbers.
- On the exchange rate, the key issue is that the reality of acute foreign exchange shortages facing businesses means the current approach is not working. These problems started when the previous policy of a floating exchange rate with full currency convertibility was changed (see here).
- Talking of minor loans from the IFC and hopes of commodity price improvements does not deal with the underlying causes of the imbalance.
- Possibly a crawling peg system is appropriate for PNG, but the shortages in the market indicate the exchange rate, however determined, is not at the right level as yet.
- On economic diversity, the Governor’s states in Cairns that “We can clearly state that we have a very diverse composition of GDP.” (earlier link to speech).
- In August at the Brisbane Investment Conference, the Governor stated “The source of economic development and growth is narrow. It does not cover the great majority of the rural population.” (Page 2 of speech available here).
- As outlined in this earlier article, and there is nothing in the new GDP figures (currently released!) which changes this growth analysis, movements in economic welfare for most people (and businesses) in PNG are best measured by growth in real GDP per capita in the non-resource sector. This was negative in 2014 and 2015 despite the resource boom. Standards of living for most people in PNG, and growth opportunities for most businesses, declined in 2014 and 2015, despite the start of gas shipments.
- The renewed emphasis on more inclusive growth is welcome but it needs to be implemented in ways that are sustainable and bring PNG into the Asian century of opportunities.