All posts by pngeco5_wp

PNG’s Descent to a Fragile State – Can it recover again?

A recent Development Policy blog, with an accompanying research paper, explored the question of whether PNG was a fragile state – ANU Devpol. The article opened with a reference to a Parliamentary question asked by then Shadow Treasurer, now Treasurer, the Hon. Ian Ling-Stuckey.  Below is a copy of the question that was asked – this is done for reasons of public transparency as such questions are hard to access on the public record. It highlights the basis for the claim that PNG had descended back to fragile state status were World Bank and ADB indicators of “fragile situation” countries. The source materials and analysis were included in the question (which is provided to the PNG Parliament’s speaker).

One particularly interesting element of the background analysis, not explored fully in the Devpol analysis, is the dynamics of such a status. PNG had climbed out from being a failed state during the year’s 2007 to 2013. It then fell back into that failed state status by 2014. This was driven mainly by a fall in measures of economic management during the O’Neill years according to the analysis of the World Bank and ADB. Since 2020, the listing has been simplified. PNG is still in the listing as a “High Institutional and Social Fragility” country  http://pubdocs.worldbank.org/en/888211594267968803/FCSList-FY21.pdf

Hopefully, improvements in economic management  and continued friendly foreign support will allow for one of the positive scenarios in the Devpol analysis.

[Disclaimer: The author currently works as Principal Economic Advisor to PNG’s Treasurer Ian Ling-Stuckey]

“QUESTIONS WITHOUT NOTICE

WEDNESDAY 29 August 2018

PNG Descends to be APEC’s Only “Fragile State” According to the World Bank and Asian Development Bank.

Thankyou Mr Speaker,

My questions are directed to the Treasurer, on the economic status of Papua New Guinea and its standing in the international community.

Mr Speaker, there are international criteria, for whether a country is termed diplomatically as being in a “fragile situation” – just a nicer term for the early and more normal reference for whether a country is known as a “fragile state”.  According to publically available data from the World Bank and Asian Development Bank, after years of improvement during the years of the National Alliance Government, PNG has fallen to once again, becoming listed, as a “fragile state”. And we do not share, good company in this rating. The only other countries considered to be low to middle income and “fragile states” are Zimbabwe, suffering from the legacy of the autocracy of the Mugabe years, and Timor Leste, recovering from the civil conflict from its separation from Indonesia.  PNG is behind, the rankings of low income countries such as Chad, the Republic of Congo, Kosovo, Liberia and Mozambique. Indeed, there are only 12 countries in the world with a rating that are lower than PNG – such as Eritrea, Yemen, Afghanistan and South Sudan. So this is not good company.

My Questions are:

  1. Treasurer, in this year of hosting APEC, why is PNG now the only APEC “fragile state”? How do you explain this embarrassing position for our country?
  2. Treasurer, will you concede that when looking at World Bank assessments of why PNG has gone backwards and become fragile, most of these are in areas of your responsibility? So once again, why is it that independent outside commentators consider that PNG is going backwards economically, while you have continued to paint a rosy picture of the economy when dismissing other commentators such as Moodys, and Standards and Poors, when they downgraded our international credit rating – the worst downgrades in PNG’s history?
  3. Specifically Treasurer, can you explain why the World Bank’s ratings have lowered PNG’s economic management from 4.0 in 2012 to 2.8 in 2017, a key cause of PNG becoming a fragile state? Can you explain why the World Bank’s ratings have lowered PNG’s economic management from 4.0 in 2012 to 2.8 in 2017 a key cause of PNG become a fragile state? Can you explain why the World Bank’s ratings have lowered PNG’s macroeconomic management from 4.5 in 2013 to only 2.5 in 2017, a key cause of PNG become a fragile state? Can you explain why the World Bank’s ratings have lowered PNG’s debt policy from 4.5 in 2013 to 3.5 in 2017, a key cause of PNG become a fragile state? Can you explain why the World Bank’s ratings have lowered PNG’s debt policy from 4.5 in 2013 to 3.5 in 2017, yet another key cause of PNG become a fragile state?
  4. Treasurer, when will you finally start giving some more respect to outside economic commentators that are clear that PNG is suffering under the policies of the PNC? When will you concede that PNC’s poor economic management has cost over 100,000 formal sector jobs and a decline in average incomes of K1,000 per person? Will you now apologize to the people of PNG, for the failing economic policies of your government, which have driven PNG to the embarrassing position of being officially considered, a “fragile state”?

Thank you Mr Speaker!

HON.IAN LING-STUCKEY,CMG.MP

SHADOW MINISTER FOR TREASURY & FINANCE

Source: Country Policy and Institutional Assessment Ratings for PNG updated 28 June 2018 – data download from World Bank Group, CPIA database (http://www.worldbank.org/ida).

Details of rankings

Examples of downloads from the Harmonised List of ”Fragile Situations” available at http://www.worldbank.org/en/topic/fragilityconflictviolence/brief/harmonized-list-of-fragile-situations

Note that the name of this list has become “more diplomatic” over time.  So it used to be called the fragile states” list as indicated in the second para below.  Note that the group in the World Bank that puts this list together is known as the World Bank’s Fragile, Conflict and Violence Group.

This is the list from the FY19 list available by clicking http://pubdocs.worldbank.org/en/892921532529834051/FCSList-FY19-Final.pdf

This information is used in a range of other reports.  For example, in the World Bank’s recent Health Assessment of PNG, it included the following excerpt on page 3. This used the FY17 rating of 3.13 (below 3.2 is “fragile”. Over the last two assessments, the rating has now declined to only 2.91.

Simon Tosali – A Great Treasury Secretary

Simon Tosali

PNG has lost one its greatest public servants ever.

Simon Tosali was Secretary of the PNG Treasury from 2002 to 2013. Behind the scenes, and working with others in his quiet, wise, influential way, he helped shape the best economic times ever experienced by Papua New Guinea.

As Simon is buried on Sunday in his home village, many people will tell stories of his greatness, his humility, his humour, his wisdom, his love of PNG with all of its complexities.

Let me focus on the numbers.

While Simon Tosali was Secretary of Treasury, the key parts of the economy grew at the fastest rate in PNG’s history. As Simon understood, the real measure of growth was the non-resource sector, so setting aside the resource sector which is largely foreign owned. In 2001, PNG’s real non-resource GDP was K17.0 billion. By 2013, it had nearly doubled to K32.8 billion (2015 Kina prices).

While Simon Tosali was Secretary of Treasury, the non-resource economy grew at over 6 per cent every year – double the population growth rate. In the decade before he was Secretary, the real non-resource economy did not grow at all – indeed, it slightly fell. In the years since Simon left as Secretary, the real non-resource economy has only grown by only one per cent per year.

The economic growth story.

  • Before Simon for a decade economic growth of 0% per year.
  • With Simon economic growth of 6% per year.
  • Since Simon economic growth of 1% per year.

While Simon Tosali was Secretary of Treasury, employment levels grew at the fastest rate in PNG’s history. Formal sector employment grew from 231,000 in 2002 to 395,000 jobs in 2013. This was a growth rate in the formal economy of an extra 15,000 jobs every year.  From 1991 to 2002, the growth rate in jobs per year was 1,500 jobs per year – only one tenth the Simon rate. Since 2013, formal sector employment has gone backwards by 9,000 jobs per year to 350,000 at the end of 2018.

The jobs story.

  • Before Simon for a decade jobs growth of 1,500 per year.
  • With Simon jobs growth ten times higher of 15,000 per year
  • Since Simon jobs going backwards by 9,000 per year.

While Simon Tosali was Secretary of Treasury, PNG’s debt levels reduced by the largest amount in PNG’s history. The key debt to GDP halved from 70% in 2002 down to 34% in 2013.

While Simon Tosali was Secretary of Treasury, inflation fell from 12 per cent per year to less than 5 per cent per year.

As a nation, let us celebrate the life of one of PNG’s greatest public servants.

I have lost a dear friend – I miss his wisdom and friendship. I enjoyed our lunches together since I was allowed back into PNG. I was so saddened to see him in the Port Moresby General Hospital after his stroke. I am angry that his abilities were not properly respected in the years since he was forced to leave the Secretary role. I will miss our sharing of a good bottle of red wine together. Tonight, I will open a bottle of Wolf Blass Shiraz that I had bought for what I had hoped would be another good time together – a State of Origin label in blue. Not many of us in PNG would have gone for the blue label rather than the maroon label!

In honour of a great PNG public servant. My condolences for his wife, his children and his broader family and friends.

With the greatest of respect to a dear friend and great leader in PNG.

Paul Flanagan

PNG’s Resource Curse: Double or Nothing Revisited

Executive Summary

Do the controversial conclusions of the “Double or Nothing: The Broken Economic Promises of the PNG LNG project” report still hold? The broad answer is “Yes” – indeed the conclusions are re-enforced by recent economic data. Fortunately, PNG’s new Marape/Steven government is seeking better terms for future projects. It is too early to tell if it will make even more important but politically difficult policy changes to reverse the “resource curse” approaches of the O’Neill government.

  • Recent PNG National Statistics Office figures have confirmed that PNG Treasury was over-estimating the health of the PNG economy in 2016. The new figures increase the gap between PNG LNG promises and actual outcomes relative to “business as usual” prior to the PNG LNG project (see “statistical details” section below for detail).
  • At a more detailed sectoral level, there is a mixed story with sectors such as health not doing as badly as thought (now ‘only’ minus 27%) but manufacturing doing worse (now minus 32%). The average outcome remains that PNG’s industries were just over one-fifth worse off in 2016 than if they had simply continued the “business as usual” growth prior to the PNG LNG project.
  • Overall, the PNG LNG project massively over-promised and then failed to deliver. This is not because of the fall in oil prices – indeed LNG export returns are higher than predicted.
  • Resource projects on good terms should be good for development – but this requires good policies. The PNG LNG project induced poor policies under the O’Neill government. These poor policies have overwhelmed the potential PNG LNG benefits.
  • The O’Neill government made little progress on the four recommendations from the report designed to address the broken promises of the PNG LNG project (see below). This probably contributed to its fall.
  • There are encouraging signs that the new Marape/Steven government is seeking better returns from its resources. Hopefully, it will also pursue better policies in other policy areas such as competition policy and devaluing the exchange rate to deal with the resource curse. But these will be politically difficult.

Details

The release of national accounts information by the NSO in April shows lower GDP and non-resource GDP (a proxy for household incomes) in 2016 relative to the PNG Treasury forecasts used in the earlier analysis. This has the effect of increasing the gaps between the PNG LNG modelling predictions, and actual outcomes. Specifically, the PNG LNG modelling had projected an increase in GDP of 97% two years after production had commenced. The actual outcome relative to the pre-PNG LNG “business as usual” case was a 6% increase – down from 10% in the initial report. For household disposable income, the prediction was an 84% improvement. The outcome is a decline of 9%, larger than the decline of 6% estimated in the earlier report. Using updated Bank of PNG figures on employment, the prediction was an increase of 42%. The outcome is now estimated as a fall of 26%, slightly smaller than the 27% decline in the earlier report. There is no new data on exports, imports and government expenditure.

The following graph updates that on page 6 of the Executive Summary of the initial “Double or Nothing” report. It contrasts PNG LNG predictions with actuals all relative to the pre-PNG LNG undergrowing growth path (or ‘business as usual’ growth case which was running at 5% growth per annum).

Of course, many people have benefited from the PNG LNG project such as local transport, catering and security firms, the support for local health and education facilities, the work of project partners in responding to the 2015 drought and 2018 earthquake, some tax and dividend revenues, and some landowner benefit payments (although see a related Jubilee Australia report “On Shaky Ground” (see here) which discusses some adverse local impacts and broken promises at the local level). However, taking a helicopter view of the entire economy, household incomes, government expenditures, employment and import levels were worse by 2016 than if the pre-PNG LNG underlying ‘business as usual’ growth trends had continued.

The reasons for failing to deliver had nothing to do with the fall in oil prices in late 2014 – see here (although a continuation of historically high oil prices would have helped). Indeed, as shown by the first columns in the above graph, the PNG LNG project is actually earning more in export incomes than initially projected. The reasons for failure are linked to the O’Neill government’s policy shortcomings in not addressing the well-known “resource curse” risks of a major resource project:

  • a 50% build-up in spending before revenues flowed that has led to the largest on-going budget deficits in PNG’s history;
  • crippling foreign exchange shortages due to poor exchange rate policies;
  • a failure to put enough policy effort into other critical sectors of the economy;
  • unwise state investments such as the Oil Search purchase funded by the UBS loan; and
  • growing corruption.

As documented in Chapter 5 of the earlier report, the O’Neill government continued to ignore local and international warnings that PNG LNG required appropriate policies to manage the possible adverse impacts on other parts of the economy once the construction phase was completed. PNG slid into classic resource curse policies. Indeed, those making such warnings were often attacked – a classic case being when Isaac Lupari accused me of being unprofessional and working for former Treasurer Don Polye when all I did was to correctly claim that the fall in oil prices in late 2014 would affect 2015 budget revenues. His claims that PNG would largely be sheltered from such falls was false as was his claim that I was still working for Don Polye (although I admired Don Polye including for his stand on the UBS loan and I did work for Polye as a public servant when he was Treasurer). If such warnings had been listened to, the O’Neill government could have made a more rapid fiscal response which would have lessened PNG’s current debt burden.

The “Double or Nothing” report was condemned as “utter nonsense” by former Prime Minister O’Neill (even though he subsequently admitted to the press that he hadn’t read it). Oil Search CEO Peter Botten promised to subject the report to “rigorous analysis” by an independent accounting firm to “demonstrate that there are some serious flaws in the Jubilee report” (see AFR report here). This was not done, or at least the findings have not been released over the last year. Fortunately, former Treasurer Charles Abel did acknowledge that project returns were indeed below par. More recently, the Papua LNG project partners have been more cautious in selling the latest project and we do not have the black magic PNG-GEM model making more overly-optimistic promises. However, the PNG public still does not have access to the economic modelling behind such key claims that the Papua LNG fiscal agreement “divides the net free cash flow 50/50 between PNG and Total led developers”. More transparency is required.

It is encouraging that the new government appears to be taking a more balanced approach towards the resource sector and its potential contribution for inclusive development. Prime Minister Marape’s discusses PNG’s resources as going beyond minerals and gas to agriculture, forestry, fisheries and human resources. Given his strong legal background, including as a former Attorney General, appointing Kerenga Kua as the new Petroleum Minister should help address local concerns about current and prospective LNG agreements.

There is also positive language on gauging views on what needs to be done to create a healthy economy even if it means he doesn’t make many friends (see here). The strong stance on corruption is welcome. However, some policy corrections to move away from the resource curse will be extremely challenging politically. For example, PNG has an over-valued exchange rate which acts as a subsidy on all imports and a tax on all exports. It reduces incomes for rural households yet lowers the cost of living especially in urban areas (the latter because more consumption is imported). However, urban elites appear to have a stronger voice in PNG than the much more numerous rural poor. PNG has also moved away from competition and trade policies that would balance the resource sector and allow PNG to benefit from its strategic location in the Indo-Pacific region. Policies such as high tariffs to protect local manufacturing are understandable but economic history shows the costs for the many outweigh the benefits for the few. These are two examples of the vexed political economy challenges facing the new government. Addressing such policies are critical to addressing PNG’s resource curse. They are at least of equal importance as getting a better direct benefit return from resource projects. Time will tell if the new government will tackle such difficult political economy challenges, challenges that must be addressed to make PNG a much richer black Christian nation.

My next article will explore the different economic impacts of the construction phase and the production phase of large resource projects. The dramatically different economic impacts across these two phases could help explain why former Prime Minister O’Neill wanted to push through the Papua LNG project against the advice of his local team.

Recommendations Re-visited

The “Double or Nothing” report included four recommendations for the PNG government.  One year on, how have they gone? Following are the four recommendations, with some comments on progress shown in italics.

1. PNG should return to more inclusive development policies while better managing the resource curse. There is a need to address the overvalued exchange rate, ensure the new medium-term fiscal plans are implemented in a  transparent fashion, and re-design the SWF to ensure all resource revenues flow to the budget.

As noted above, there are some positive messages that the new government may consider action in such policy areas. Over the previous year, there had been no improvement in managing the exchange rate (the sovereign bond did not address the underlying issues), the medium-term fiscal plans faced major inconsistencies between the 2019 Budget Strategy and the actual 2019 Budget, and there was little progress on the SWF (which needs to be redesigned anyway).

2. PNG should establish a clear policy framework for all future resource projects (and extensions) that ensures PNG gets a better and earlier share of the resource pie than current agreements. No new resource projects should be approved until this framework is completed and publicly released.

This was not adequately done prior to the Papua LNG agreement. While the new deal has improved some elements of the PNG LNG deal, there clearly was a lack of internal agreement as to whether enough extra had been gained.

3. Projects should not be approved without the production and release of transparent, verifiable, contestable and independent economic modelling by the government; this modelling should include a completely new independent model that includes net costs to the budget.

Fortunately, there was little PNG-GEM spruiking of the new Papua LNG project. However, it did appear to be making claims of future revenues as well as benefit sharing that were not verified by transparent figures or modelling.

4. PNG should urgently clarify some of the confusing figures in the most recent EITI reports that royalties and development levies paid by ExxonMobil are not being received, and explanations provided as to why the level of what should be identical payments are so different.

EITI continues to do a good job in PNG given data limits. However, key information such as the Kumul Petroleum Holdings annual accounts have not been released. Recent data indicates that PNG Treasury had been claiming as “dividend revenues” funds that were actually just “advances” financed by loans from BSP.

Overall, progress against the four recommendations had been poor. That said, it is quite possible that the original report helped confirm and strengthen views in PNG that future projects needed considerably better deals. As stated a year ago “As the government considers this report, there are potential benefits for PNG in terms of encouraging public discussion about PNG’s future options and even supporting PNG’s negotiating hand with the LNG companies. Hopefully, with the benefit of hindsight, “fake news” comments will fade and true benefits will be understood.” Given developments over the last month, possibly the O’Neill government didn’t deal adequately with the broken promises of the PNG LNG. The new government appears committed to not repeating that mistake in terms of benefit sharing. Time will tell if it will also address the crucial underlying “resource curse” policy issues.

Statistical background

The PNG National Statistics Office released updated national account figures for the PNG economy on April 10 2019. This release included detailed figures for 2015 and 2016. The new numbers would be more robust that the earlier PNG Treasury estimates, although they are likely to still be too high (see here). The release also provided consistent figures for 2006, but these did not include new growth rate figures for 2006. If it had, this would have allowed a re-estimation of underlying growth rates which had been based on the three years growth rates for 2007 to 2009. Given that 2008 was actually a year of recession according to the NSO (with growth falling by 0.3%) the inclusion of 2006 information is likely to have lifted the estimate of “business as usual” real GDP growth to slightly above 1.7% per annum in per capita terms, or 4.8% without taking population factors into account. More detailed justification around the “business as usual” growth rates are provided here. The next article will also provide some sensitivity analysis around “business as usual” growth rates.

Using the same methodology as outlined in appendix 2 of the earlier report, three actual 2016 values are updated (shown in green in the following table). These lead to three updated figures for the difference between what the 2016 value would have expected to be if “business as usual” pre-PNG LNG situation continued and the actual 2016 value.

The updated story at the sectoral level also produces slightly worse outcomes. The following table sets out the expected sectoral impacts from the PNG LNG modelling in the second column. The third column covers the gap between the underlying sectoral ‘business as usual’ growth path and the available PNG Treasury figures for 2016. The fourth column uses the recently released 2016 NSO data (except for agriculture exports which continues to use BPNG data). Some sectors have not done as badly as set out in the initial report. For example, the health sector has “only” declined by 27% when the original estimate was a decline of 33%. Other sectors have done worse. For example, the manufacturing sector has declined by 32% rather than the initial estimate of a decline of 23%. The overwhelming story remains – all sectors in the PNG economy outside of the petroleum and LNG sector have gone backwards relative to their underlying ‘business as usual’ growth performance prior to the PNG LNG project. The average decline is now 23%. This is an extraordinary missed opportunity with poor policies pushing PNG away from the “business as usual” pre-PNG LNG case. It is also a remarkable contrast to the foreshadowed gains averaging 36% from PNG LNG partners.


PNG National Statistics Office National Accounts Update – A deep analysis

Executive Summary

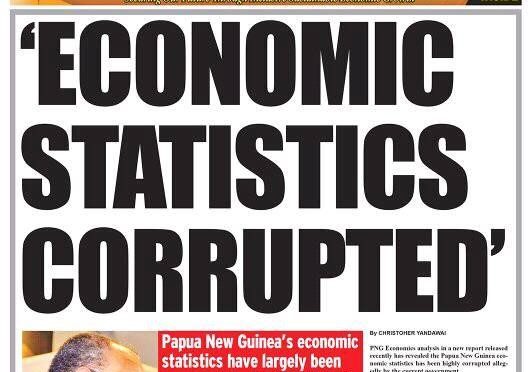
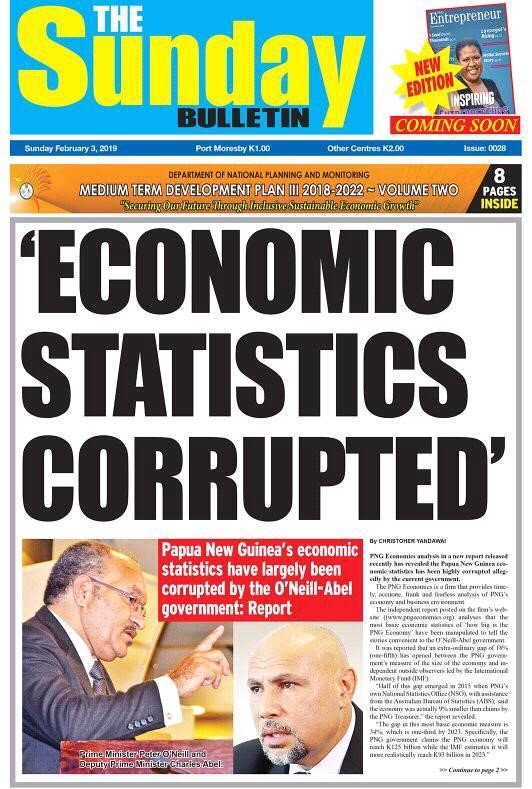
  • PNG’s economic statistics are still corrupted – some figures slip through but others are manipulated to protect the government. Despite an attempt to justify the significant variations from earlier releases, these explanations are riddled with major errors and omissions. The latest National Statistics Office release chooses a GDP estimate slightly towards the government side rather than the IMF/World Bank estimates of the economy. Just enough is done to keep the debt to GDP ratio below the legislative limit of 35%.
  • PNG’s living standards have fallen by 10% since 2014 – an extraordinary backward step when 40% of the population was already judged to be living in absolute poverty.
  • In contrast, the resource sector has more than doubled even in real per capita terms since 2014. The vast majority of this increase goes to foreign shareholders and foreign debt holders. Most spill over effects from the resource sector are actually measured in the non-resource sector (so teachers’ salaries funded by resource taxes are actually measured in the value add calculations of the education sector, contracts to trucking companies are picked up in the transport sector etc). With the major falls in the non-resource sector of over 10%, clearly the resource sector is not a tide lifting all boats.
  • PNG is suffering from the resource curse – the resource sector is booming while living standards for the PNG population are falling. The underlying reasons are as economic theory predicts – poor management of fiscal booms and busts, poor monetary policy undermining competitiveness and creating foreign exchange shortages that cripple growth, a lack of policy consideration to agriculture, SMEs and the informal sector.
  • There is a need for an independent assessment of PNG’s economic statistics. Even more importantly, there is a need to change PNG’s development path towards one of inclusive development rather than pro-resource development.

A. The Politics of the NSO release

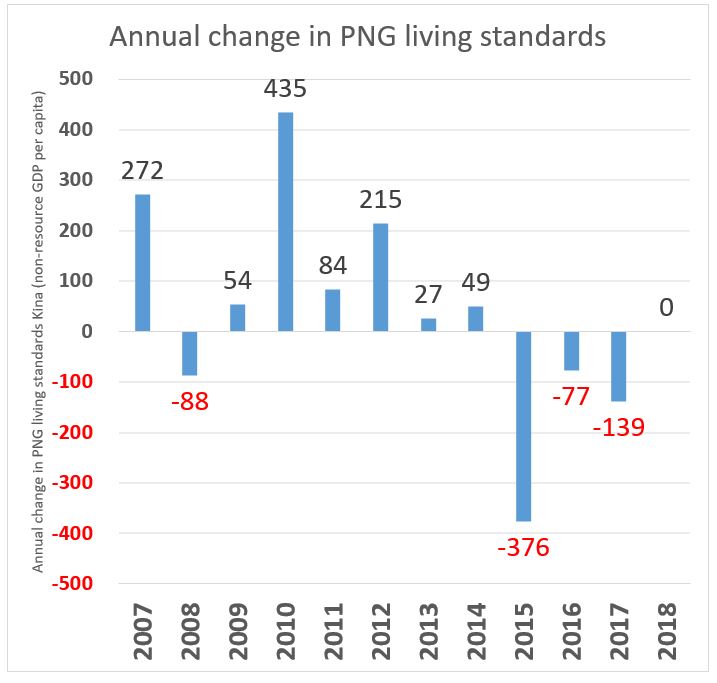
Statistics are usually boring. Lots and lots of numbers and details. The recent release by PNG’s National Statistics Office of the National Accounts from 2006 to 2016 could easily be seen as a boring document. However, the figures also tell a fascinating political story. They represent some credible pushback on the corruption of PNG’s statistics, but the details reveal the possibility of on-going political interference. The new statistics also have a very worrying bottom line – living standards in PNG have gone backwards by over 10% over the last five years – over K500 for every single person in PNG on average (after allowing for inflation, population growth and taking out the largely foreign owned resource sector). The statistics confirm a general GDP recession in PNG in 2008 (and there was probably another one in 2018) – so PNG cannot claim to have continuous growth over the last sixteen years as senior politicians continue to claim. PNG’s living standards have gone backwards or stayed constant in four of the five last years.

A key political implication of the most recent release is that the Secretary of the PNG Treasury, Dairi Vele, has been lying about why PNG’s national accounts have been suppressed since a very inconvenient preliminary release by the NSO nearly one year earlier. His explanations, in official budget documents and Treasury briefings, have all focused onissues around the price index. As expected (see here) there is absolutely no support for Vele’s explanations in the actual NSO release. The 2017 changes introduced in the new NSO methodology, and which were initially warmly embraced, have been confirmed in the latest report. Indeed, the change in price indexes used to calculate real GDP have overwhelmingly reduced real GDP measures.

Vele’s lies are difficult to interpret other than in the context of his close support for Prime Minister O’Neill (who some say was instrumental in Dairi being flown into the top Treasury job after the ousting of well respected former Secretary Simon Tosali and over the top of strong internal candidates) and the economic narrative of the O’Neill/Abel government. The politicisation of the key economic positions in PNG (including the BPNG Governor) has added to economic mismanagement in PNG.

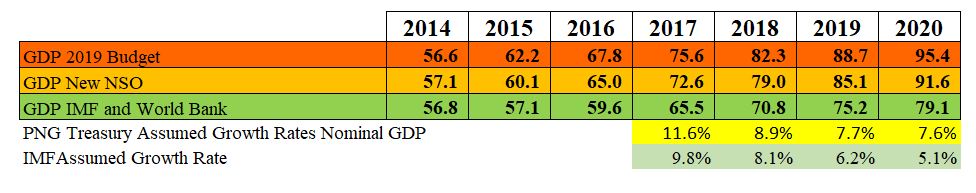
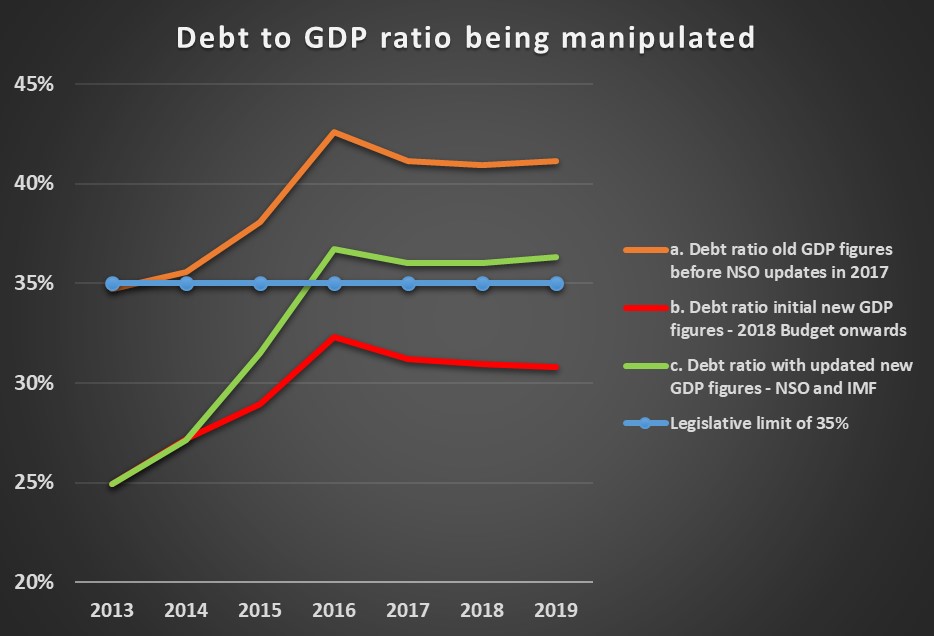
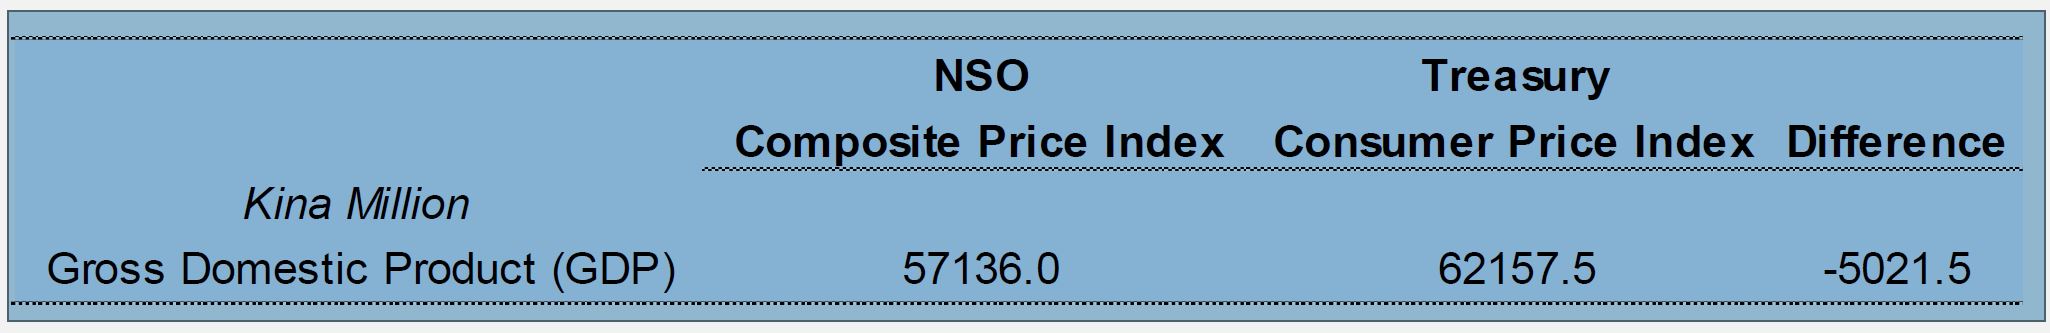
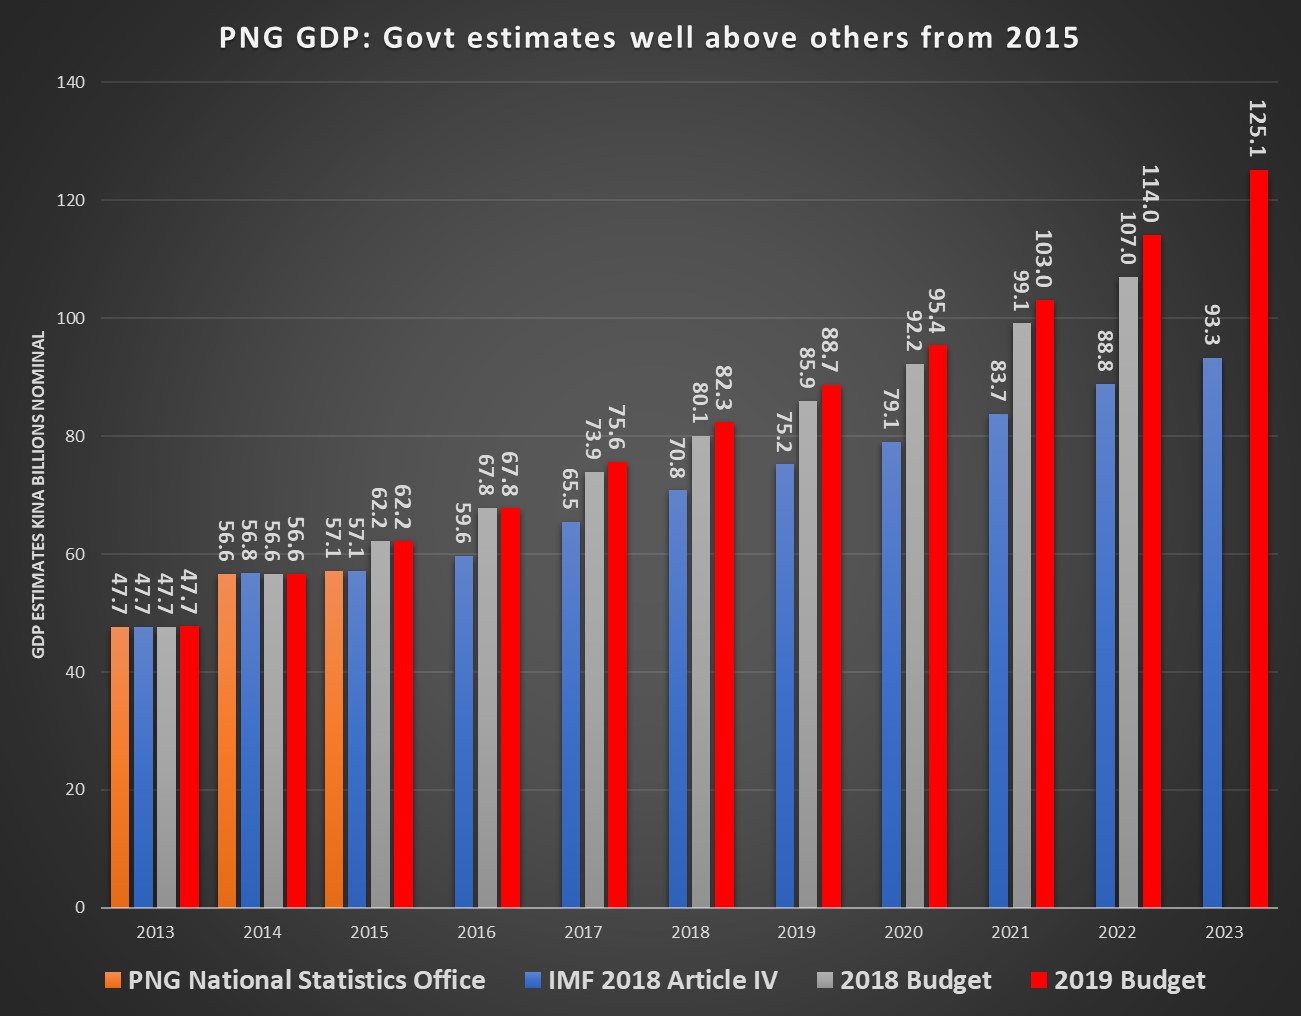
The new set of statistics are an extremely convenient political compromise between the initial NSO estimates for the size of the PNG economy (supported by the IMF and World Bank) and the figures used by the PNG Treasury in the 2018 and 2019 budgets. Specifically, the NSO initially indicated the size of the PNG economy in 2015 was K57.1 billion. The PNG Treasury (so Vele and Abel) said it was K62.2 billion. The compromise figure has come out at K60.1 billion, slightly closer to the government’s figure than the initial NSO estimate. For 2016, the NSO (K65bn) was even further away from the IMF estimate (K59.6bn) and closer to the government estimate (K67.8bn).

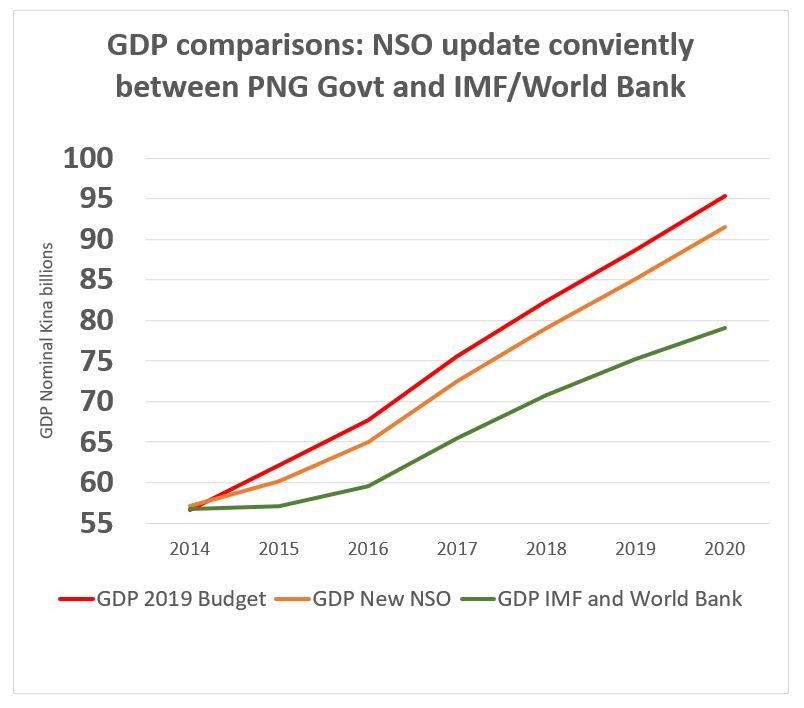
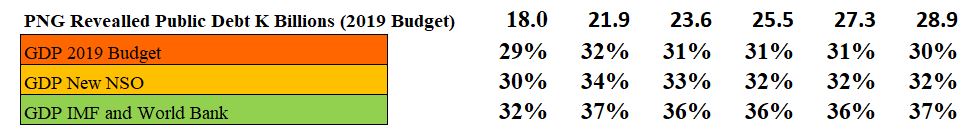
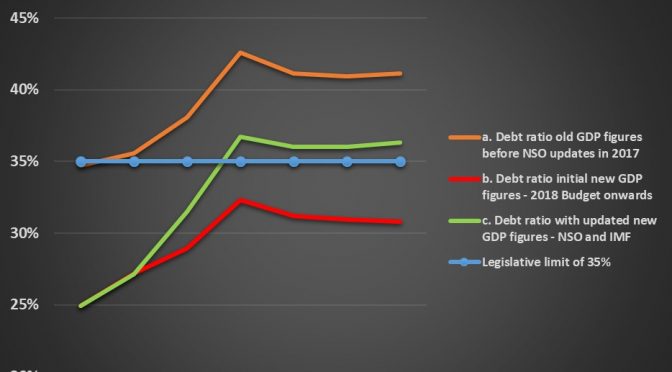
A key political problem with the initial NSO estimate was that it would have formed a base pushing the debt to GDP ratio above the legal limit of 35% (to 37% in 2016 according to the IMF’s 2018 Article IV report). The new NSO numbers conveniently keep debt to GDP below this number at 34% in 2016, only slightly higher than the government’s preferred number of 32%.

B. Are PNG’s statistics still corrupted? – Unfortunately, Yes.

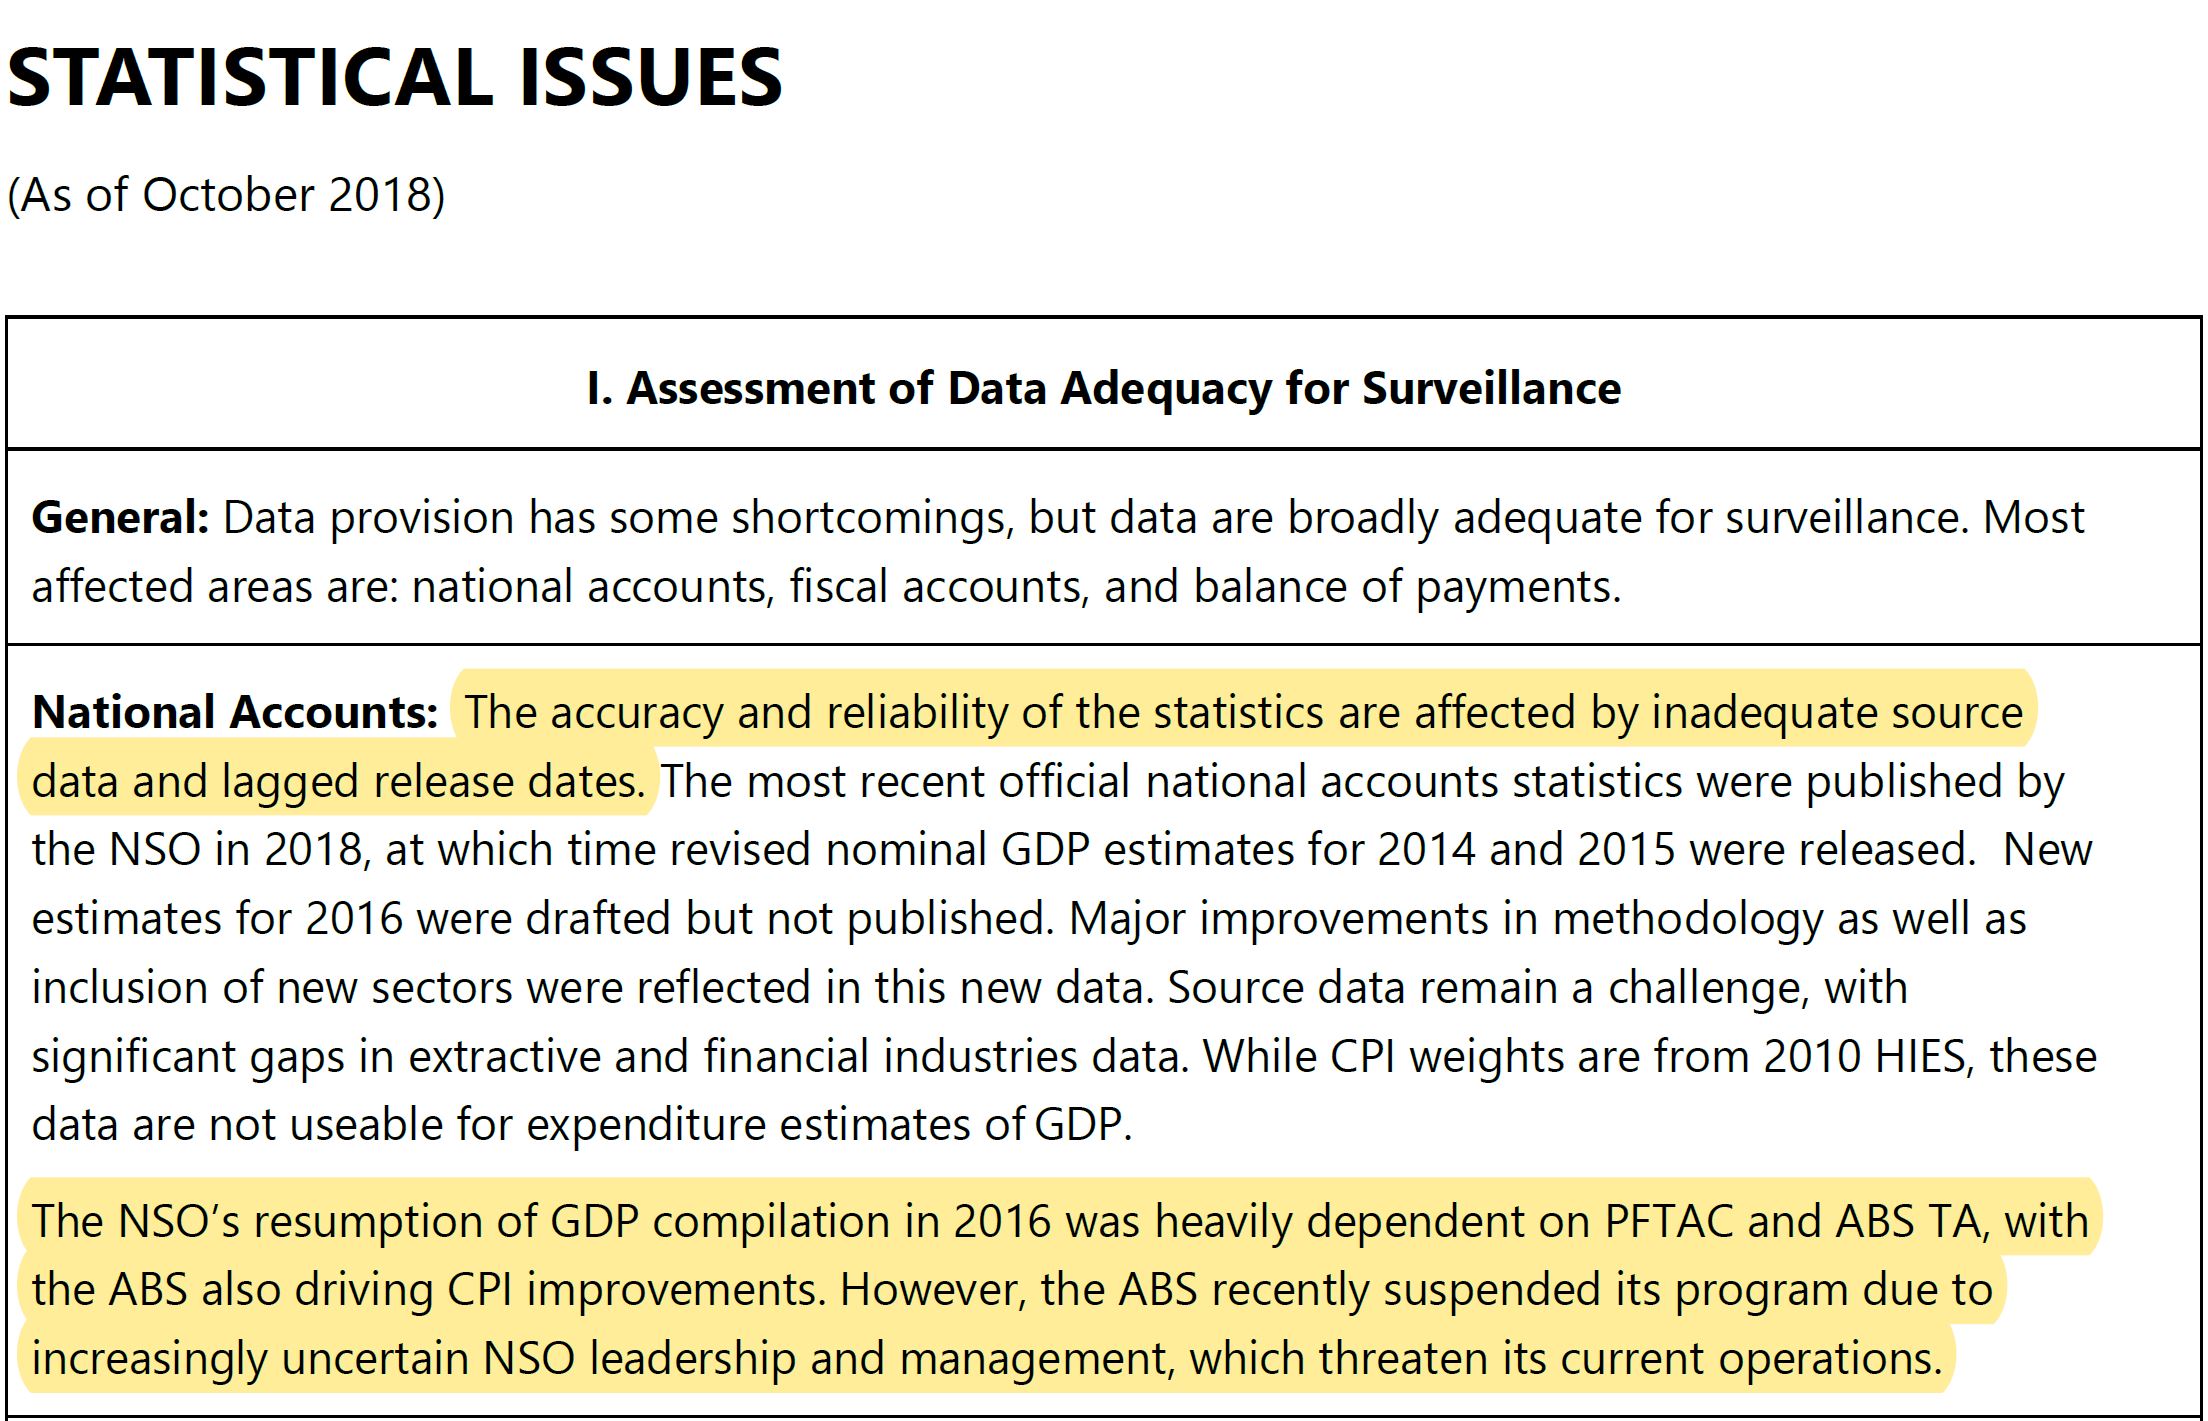
My analysis of PNG’s statistics over recent years led me to the conclusion that they were being increasingly used to tell a convenient story for the government rather than the best measurement actually available (see four articles covering this issue here and here and here and here). With a misleading explanation about why the initial 2015 GDP numbers may have issues, the continuing delay, and indications that the Australian Bureau of Statistics had walked away from providing assistance, the call was made that PNG’s economic statistics were corrupted.

While there is no doubt the front section of the latest NSO release tried to provide a comprehensive 3-page statistical explanation for the difference between the initial 2015 figures and the higher ones now produced by the NSO, and this extra transparency is to be encouraged, my detailed analysis can only conclude that there are still so many errors and inconsistencies that even the latest release cannot be trusted. Going through the errors, some are clearly just careless mistakes. But others suggest an on-going systematic attempt to inflate the GDP figures to meet the political agenda of having higher GDP growth estimates and keeping the debt to GDP ratio below 35%. Yet numbers perversely not on the political radar are allowed to slip through.

The NSO GDP outcomes conveniently ensure that the debt to GDP ratio does not increase above the legislative limit of 35%. On the new NSO figures, this ratio peaked in 2016 and then using Treasury GDP growth estimates thereafter, they are likely to continue falling. This is in contrast to the estimates used by the IMF in its Article IV survey of the PNG economy which showed a pattern of on-going breaches.

The latter part of this analysis goes into considerable depth to justify the argument that PNG’s economic statistics remain corrupted. The key concern is that a comparison of the earlier 2014 figures with the new 2014 figures shows that the NSO fails to justify the nearly K1.5 billion increase in estimated constant price GDP in 2014. There are discrepancies in 18 of the 20 line items covering the constant price estimate (shown in yellow in the detailed tables below) – an extraordinary error rate between the actual changes in the figures and the explanations. Such a detailed comparison cannot be made for the 2015 figures. However, there are patterns within those numbers that also are entirely inconsistent. The explanation for the change in the resource sector actually makes good sense (need to reduce the estimate of intermediate petroleum consumption), but it is implemented in a clumsy and potentially manipulated way. The explanation for movements in the resource sector in 2016 are also internally inconsistent. The details for this analysis are provided at the end of this document – but beware, it includes lots of analysis and detail!

C. The true story slipped through – PNG’s dramatic 10% fall in living standards

However, the new figures and how they’ve been used also reveal the government’s almost exclusive focus on the size of the total PNG economy and its implications for key fiscal ratios. The government’s focus in these areas allows some inconvenient truths to emerge on the true state of the wider PNG economy, especially all parts of the economy outside of the resource sector. I have long argued (as have many others) that movements in the non-resource economy are a much more accurate measure of PNG’s living standards and incomes than a total GDP figure. PNG is a very dualistic economy split between the resource sector and the non-resource sector. There are poor linkages between these two sectors with most resource production shipped overseas with revenues used to pay for loans or dividends to largely foreign shareholders. The linkages that do exist (such as contracts for transport, supplying food, resource taxation paying for government services) are actually measured in the value added of the non-resource GDP sectors. So looking at non-resource GDP actually captures the spill-over links from the resource sector, as well as all other activities such as agriculture and retail sales and construction and government employment etc. For the purpose of this analysis, the technical mouthful “real non-resource GDP per capita” is simplified to what it best measures – movements in PNG’s living standards for its population. Movements in the resource sector, given spill over effects are generally included in non-resource GDP, is almost exclusively a measure of movements in living standards for people outside of PNG.

Specifically, the NSO figures show PNG’s non-resource economy was indeed in a deep recession in 2015 with a negative growth rate (after allowing for price changes) of -4.1%. This is a long way from the positive 0.7% figure for 2015 used even in the 2019 Budget. Finally, the NSO has produced a figure that is consistent with all other key economic indicators (employment, imports, tax collections, business sales), external commentators (see UPNG/ANU Update report here) and the broad views of the business and others within PNG. After a significant recession, the usual expectation would be of a strong growth “bounce back” effect so that the economy returns to the underlying growth path. Unfortunately, this did not occur with a poor recovery of only 1.5% in 2016.

So the latest release reveals that the key parts of the economy vital for supporting the actual people of PNG has gone backwards over the combined 2015 and 2016 figures. Indeed, after allowing for population increases, average incomes in PNG fell by nearly 10% over these two years. This is a shocking truth.

Of continuing concern, even using PNG Treasury estimates for 2017 and 2018 included in the 2019 budget, is that this fall in living standards is on-going. The official 2017 non-resource growth forecast is 0.7%, well behind estimated population growth of 3.1%. The 2018 estimate of 3.1% is simply in line with population forecasts.

The key conclusion behind all the statistics from the recent NSO figures is that PNG needs to start on a new path if it really wants inclusive development.

 Detailed statistical analysis

This detailed analysis is broken into four sections. It is very detailed given the gravity of the claim that PNG’s economic statistics remain corrupted.

  1. Examining the base for legitimacy – the 2014 national account comparison
  2. The big mover – intermediate petroleum consumption
  3. 2015 and 2016 data inconsistencies
  4. Detailed table on calculating moves in the structure of PNG’s economy


A. Examining the base for legitimacy – the 2014 national account comparison


The latest NSO report covering 2006 to 2016 (available here as only the statistical tables are on the NSO website) appears to make a very detailed argument for why its April 2019 figures have changed from the figures it provided in March 2018. Indeed, there is a three page “Revision Analysis” providing detailed tables and explanations for changes in both current price GDP (which doesn’t take account of inflation or price movements between years) and constant price GDP (which does take account of price movements).

Unfortunately, the preliminary release on 9 March 2018 only provided the aggregate GDP information – so one can’t actually make a direct comparison at the sectoral level to what was in that release. However, one can make a comparison for all of the sectoral 2014 figures as these were included in the 2017 release covering 2007 to 2014. There is no suggestion from the NSO that it had previously changed its 2014 data – and if it had, it would have needed to provide explanations for the changes between the earlier public sectoral 2014 data, the non-public revised sectoral 2014 data as part of the non-published 2015 update revisions,  and the current public 2014 data.

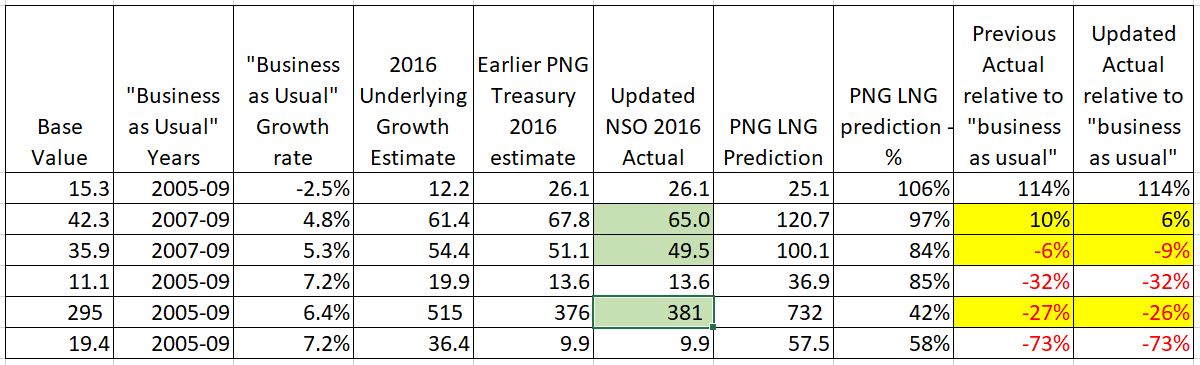
The following table extracts the relevant columns from the old and the new estimates of 2014 GDP. It consists of three parts – the first compares current price GDP, the second compares constant price GDP, and the third compares the price indexes (which are actually the mathematical link between the first two as current price divided by the sectoral price index gives constant price). For each part, the sectors of GDP are shown. The first column covers the original 2014 data, the second column the new 2014 estimates, the third column shows the difference between these two, the fourth column shows the explanation from the latest update, and the fifth column shows any difference between the actual difference in 2014 sector figures and the claimed difference from the latest update. Differences between actuals and explanations are yellow flagged as a possible area of concern.

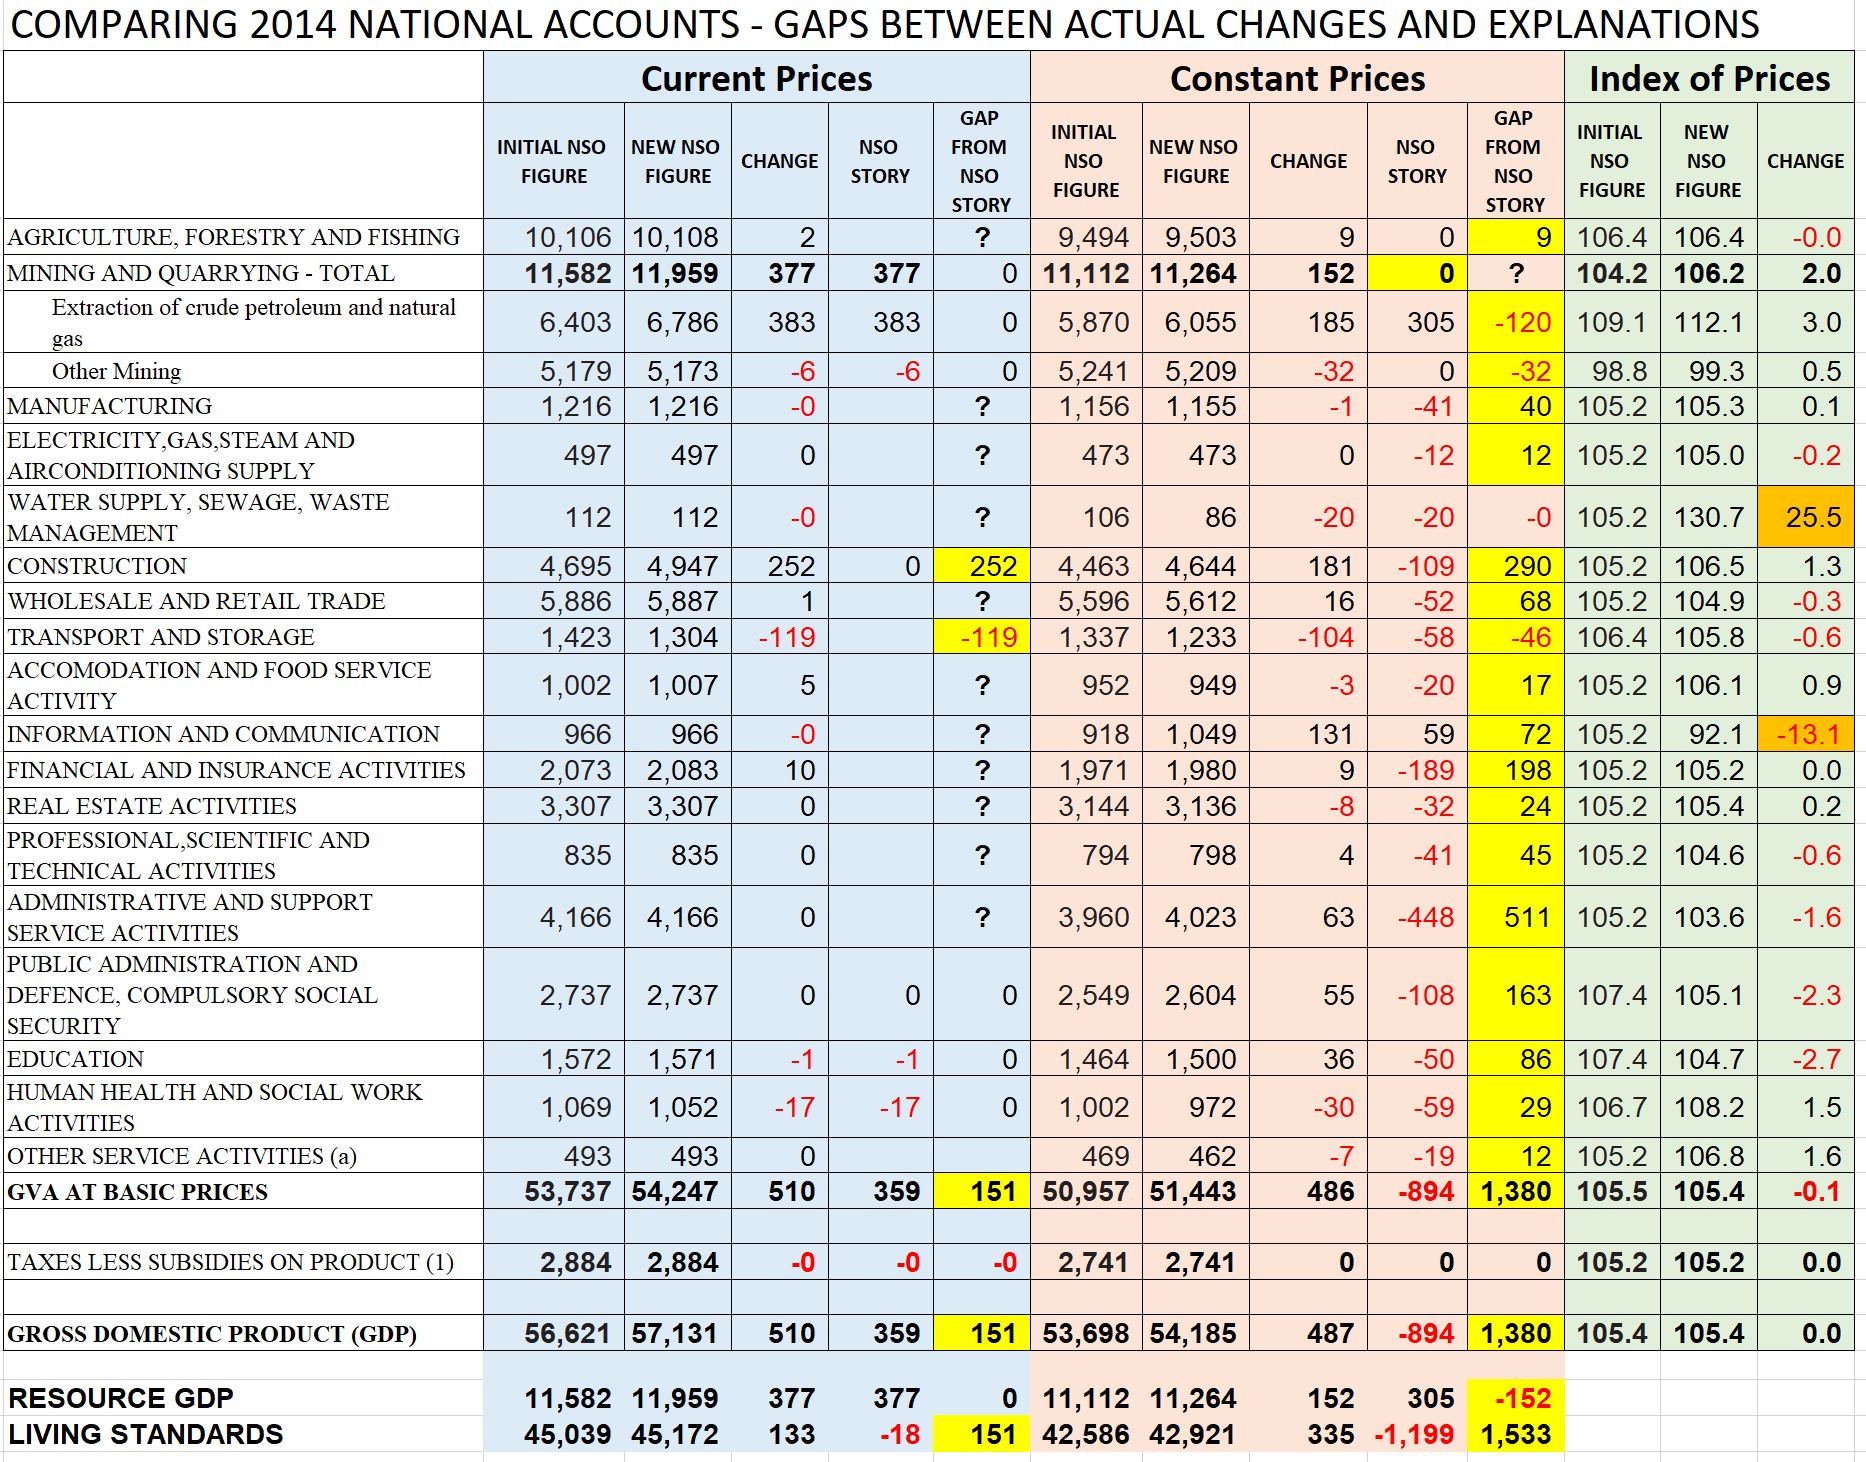
In terms of current prices (the blue section), the NSO only aimed to explain some of the differences – presumably the major ones. The explanations in the resource sector fully account for the differences. However, no explanation is provided for the K252 million increase is the estimated size of the construction sector, or the K119 million fall in the transport and storage sector. Overall, the NSO has increased the estimated size of the non-resource sector by K133 million yet explained a decrease of K18 million. In cricketing language, could let this one go through to the keeper as a lack of care in providing a full explanation for all sectors if other parts of the story were compellingly accurate – but they are not.

In terms of constant prices (the orange section), there are very major issues as shown by the number of yellow flags. There is a gap between the actual change in the sector estimates and the NSO explanation for 18 of the 20 sector lines. The concern is particularly in the non-resource sector where the actual estimate for 2014 has gone up by K335m, yet the NSO provides detailed explanations claiming it went down by K1,199. This is an extraordinary difference of over K1.5 billion. Going through the table and the explanations sector by sector, the story is particularly confusing. For example, the largest discrepancy is the “Administrative and Support Service Activities”. There is no change in the current prices – so presumably the administrative data for this sector was not updated. There was a change in the price deflator from 7% to 5% which led to the K63m increase in the estimated real size of production in that sector in 2014 (so one divides the current price figure by the price index to get to the constant price index). However, the NSO claims there was an actual decrease in real production in that sector by K448 million. Frankly, it is just not possible to reconcile this difference of K511 million in this one sector alone. The NSO reduction of K448m is also the largest adjustment figure for any sector in 2014, yet there is no explanation for the figure. Surely a reduction of over 10% in the real value of the fifth largest sector in the economy should receive an explanation? Yet there is just silence. If one was to look at just the latest NSO report, one could get the impression that the NSO update must be credible because it had actually reduced almost all the sectors of the non-resource economy – indeed a cut of over K1 billion. If the update is decreasing the size of many sectors of the economy, surely it must come across as being more credible! However, this impression is fundamentally misleading as the 2014 non-resource sector in constant prices has actually increased. This K1.5 billion credibility gap provides no confidence that other figures have not been manipulated.

The third section, looking at price indexes, could not include specific sectoral figures explaining the changes in the indexes as these were not provided by the NSO. However, as there is no change in the aggregate price index between the old and new figures (they are both 105.4), the main story is that changes in price indexes are not the reason that the NSO report has been buried for over a year, and that the Treasury Secretary’s explanations linked to the price index story cannot be believed.

B. The big mover – intermediate petroleum consumption


The NSO release spends significant time explaining a change in its methodology which lifts the current price value of the petroleum and gas sector by K383 million in 2014 and a massive K1,900 million in 2015.  This change in 2015 explains nearly two-thirds of the entire K3 billion increase in nominal GDP, so it is extremely significant.

Overall, there was indeed a problem with the old figures. But the fix isn’t right either.

The old method assumed about 38% of the total value of all petroleum and gas sales represented value added by other industries, so this needed to be deducted from the total sales figures to calculate the actual value added of the petroleum sector – and production GDP measures value added by industry to avoid double counting. For example, total sales of petroleum in 2013 were K2,447m. The value of supplies and services to the petroleum sector such as transport and security and preparing meals for workers on the LNG project were estimated at 38% of this or K932m. So for 2013, total petroleum and gas sales figures were reduced by 38% to calculate the value added by the petroleum sector of K1,515. This last number, obtained after deducting “intermediate consumption”, gives the value added of the sector which is the figure included in the GDP estimates. If this wasn’t done, there would be lots of double counting when measuring GDP.

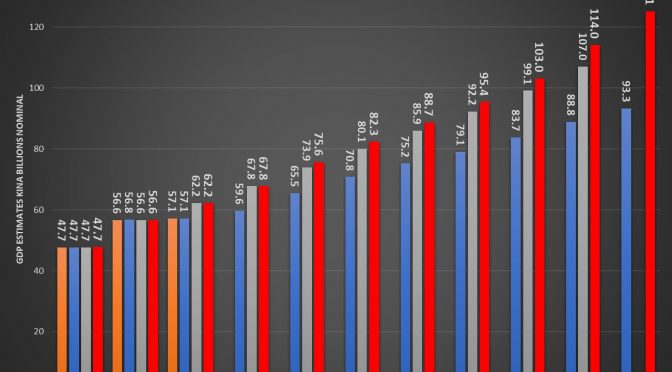
The problem is that this 38% estimate continued to be applied even though the PNG LNG taps were turned on and there was a massive increase in export sales. So the old methodology suggested that “intermediate consumption” for this sector jumped from K932m in 2013 to an unbelievable K3,879m in 2014 and then rose again in 2015 to K5,263m. Clearly, these figures were a long way from reality – indeed, the completion of the PNG LNG project possibly would have suggested these figures should have declined – or at least stayed around their previous levels of around K900m with some underlying growth rate. The new methodology phases in a reduction of the percentage of total sales being deducted from 38% in 2013 down to 22% in 2016.  However, this still leaves an estimated “intermediate consumption” of K2,724m – nearly triple the historic average.  What is going on?

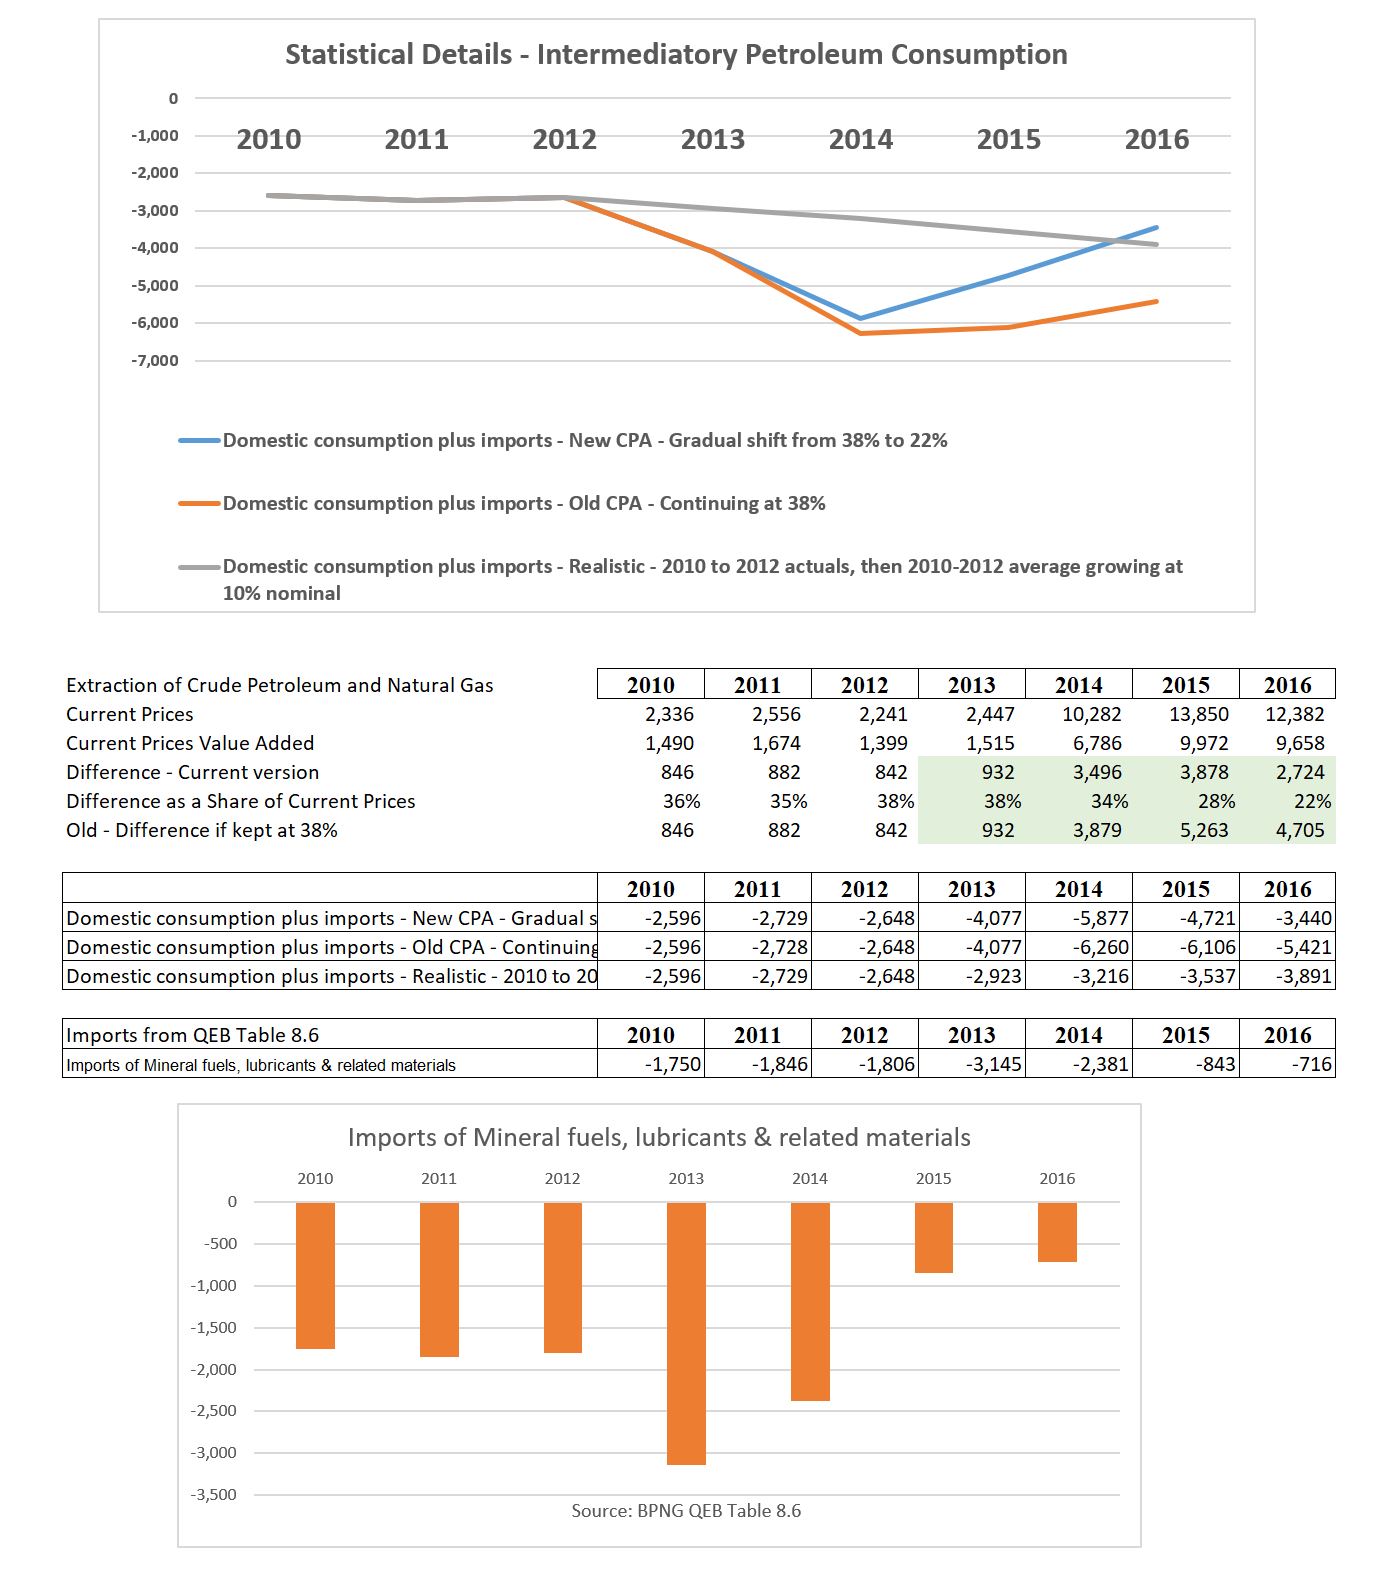
After considerable reflection, my best estimate is that the calculation also needs to deduct the value of petroleum and oil imports.  This is not mentioned in the NSO explanations. However, petroleum imports (and related products) have fallen significantly since the PNG LNG project commenced. As shown in the bottom table and graph above, oil imports have dropped from around K1.7 billion from 2010-12 down to K0.7 billion in 2016. This is a massive change and presumably reflects the substitution of previous imports (not part of PNG’s production value add) to part of the “intermediate consumption” of the petroleum sector. Allowing for this drop in imports means that the current 2016 use of the 22% figure is reasonable, although possibly overstating the actual size of 2016 GDP by K441 million (this is shown as the grey line now being below the blue line, implying a slightly larger deduction from total petroleum sales and therefore smaller GDP). One extraordinary item shown by the graph, however, is that the use of the old methodology produced significant underestimates of GDP from 2013 to 2015. Indeed, the implication is that in 2014, GDP in the petroleum sector was probably understated by some K3 billion (the gap between the orange and grey lines). The decision to only slowly phase in the adjustment in percentage terms lifted the orange line to the blue line – but this still implies GDP was under-estimated by K2.6 billion in 2014.

So if a better methodology, based on historical values for intermediate consumption including imports, would produce higher GDP numbers for 2013 to 2015, why wouldn’t the government want these higher numbers? Two possibilities. First, the gain relative to new methodology is gone by 2016 – and presumably this will be the broad case for 2017 (given continuing gas export growth) and even in 2018 (world price increases exceeded the production losses from the earthquake). The government would not want the new methodology producing lower GDP figures for 2016 to 2018. Second, given the reality of growth accounting, higher growth figures for 2013 to 2014 would lead to lower growth figures in 2015 and 2016.

C. 2015 and 2016 data inconsistencies


Section A highlighted major inconsistencies in the updated 2014 figures, their explanations, and the actual changes in GDP in 2014. Although this direct comparison cannot be made for 2015 and 2016 (as earlier figures were not released) there are still inconsistencies that are of significant concern.

Some of the 2015 explanations just leave very major doubts about their accuracy and comprehensiveness. For example, according to the NSO explanations, the largest negative revision is once again in the section titled “Administrative and Support Services”. The change in 2015 from the earlier unpublished estimates is claimed to be an extraordinary drop of K976 million – nearly 25% of the size of the entire “Administrative and Support Services sector”. Outside of the increase in the petroleum sector, this change is more than four times larger than the next closest sector (minus K201 million for the “Financial and Insurance Activities”). Extraordinarily, no explanation is provided for either of these large changes although there is discussion of the smaller government public administration sectors. So how does one get a drop of 25% in the production value of a sector in one year? The underlying current price data indicates an increase in the size of the sector from K4,166m to K4,317m – a 4% increase. It is unlikely that the earlier data would have shown a much larger increase given the economy was not doing well with the end of the PNG LNG construction phase and the severe drought hurting the economy. On price data, the figures indicate that wages and other costs in the sector increased by 8.4% in 2015 – this figure seems high as I’m not sure that many in that sector recall getting an average 8.4% pay increase in 2015. The net impact of a 4% current price increase and an 8% price increase is a constant price fall in the sector of 4%. But the revision figures suggest the first set of numbers showed a real gain in the sector of 20% (so some 25% higher). Even if there was no wage increase (so let’s push the price index down to 0% change), it would have required an increase in current prices in the sector of over 15%. This is just pushing the boundaries of belief – the economy was going backwards at the time and there is no reason that the administrative sector would be showing anything other than slow growth. The price indexes for the public sector also seem high in the new numbers – implying wage increases of 5% each year across the public sector from 2013 to 2016, and an even higher 8% per year for those in the health sector.

For 2016, there are no explanations for “revisions” as 2016 data had not been prepared. However, there still remain major issues undermining credibility, especially the contradictory explanation in constant price GDP growth. This section on page 5 of the release states that constant price 2016 GDP increased by K2,419 million with one of three “key contributing industries” being “859 million or 6.7% in Extraction of Crude Petroleum and Natural Gas”. However, the section then goes on with the extraordinary entirely contradictory comment “The main offset to this positive contribution was the Extraction of Crude Petroleum and Natural Gas with a fall of 314 million Kina or -3.1%.” This is a difference of over a billion Kina. The actual tables indicate a contribution of K859 million. Did an earlier version of the table, possibly using a different methodology, indicate the fall of K314 million? As can be seen from Section B, if it was assumed that the percentage of “intermediatory consumption” was higher, then this could easily take a billion Kina off the 2016 estimates. Implies that there may have been some last minute convenient adjustment to lift the 2016 figures – which once again undermines my confidence in the final figures.

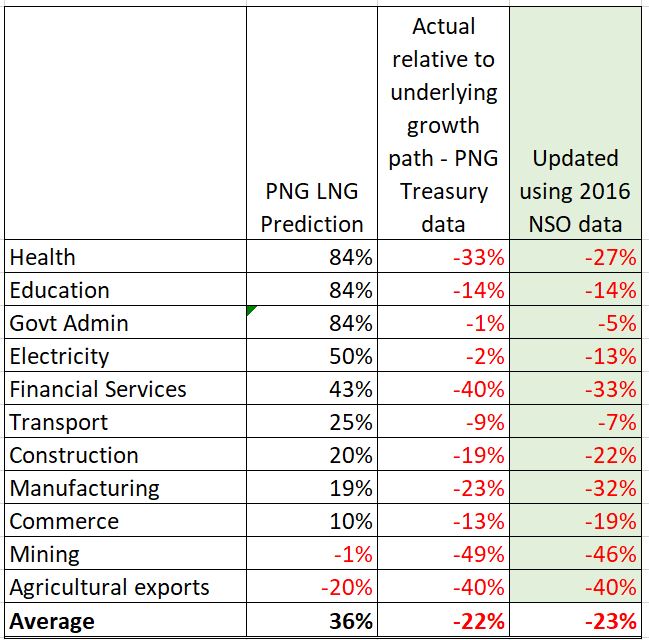
D. Detailed table on calculating moves in the structure of PNG’s economy


So despite all of the doubts about the accuracy of the estimates, and the massive changes in the estimates for the resource sector which drive nearly two-thirds of the increase in 2015 GDP, the government seems to have allowed some inconvenient figures to slip through. In many ways, this does not surprise me as the government (and others more generally) seem to place excessive emphasis on ratios such as the debt to GDP ratio (so the key issues for PNG relative to other countries are the high interest costs of debt relative to the budget and the very high levels of loan principal repayment costs – the fiscal anchors in legislation should be updated).

This section analyses the recent release for information on movements in PNG’s living standards relative to the resource sector based on PNG’s new national accounts. One positive aspect of these new accounts is that they now provide data going back to 2006. As the accounts stop at 2016, and on-going trends are of interest, the following analysis uses NSO figures for as the base and then grown according the official growth estimates of the PNG Treasury shown in the 2019 Budget. The following graph is thus based on just two official PNG government sources – the NSO for the economy from 2006 to 2016 and population estimates, and the PNG Treasury for more recent growth estimates. Consequently, the following figures are based entirely on PNG’s own official estimates.

As discussed earlier, PNG is a highly dualistic economy split between the resource sector and the rest of the economy. There are some overlaps such as tax revenue from the resource sector being spent on teachers’ salaries which are then recorded as part of the education sector in the national accounts. Services provided to the resource sector such as transport and supplying food are also captured as part of the ‘value add’ of other parts of the economy. So the usual claimed spill-over effects of the resource sector are actually captured primarily in the non-resource sectors of the economy. The main exception is local employment in the resource sector, but as this accounts for only 0.4% of total employment in the country, it is reasonable to broadly view the resource sector movements as reflecting shifts in incomes of overseas residents, and shifts in the non-resource sector as incomes for local Papua New Guineans. This is the reason why movements in non-resource GDP is the only practical measure for measuring changes in living standards in PNG. Changes in living standards need to take account of the impact of inflation – a Kina now buys much less than what a Kina could buy even 10 years ago. There is also a need to allow for population growth. The best available measure of living standards in PNG is real, non-resource GDP per capita. The following graph therefore uses the simpler language of “living standards”.

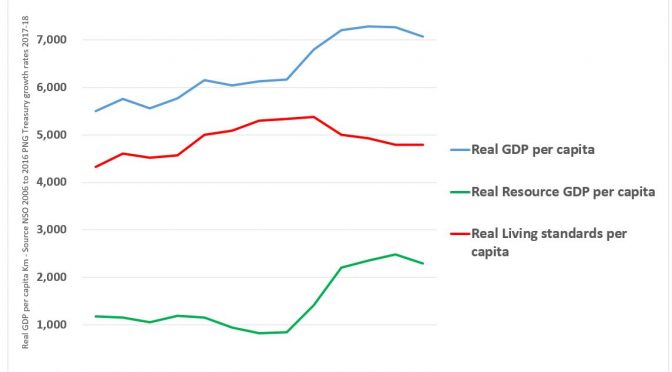
The following graph shows how the two parts of the PNG economy have moved in very different directions in recent years (the basis for the graphs are shown in the tables below the graph).

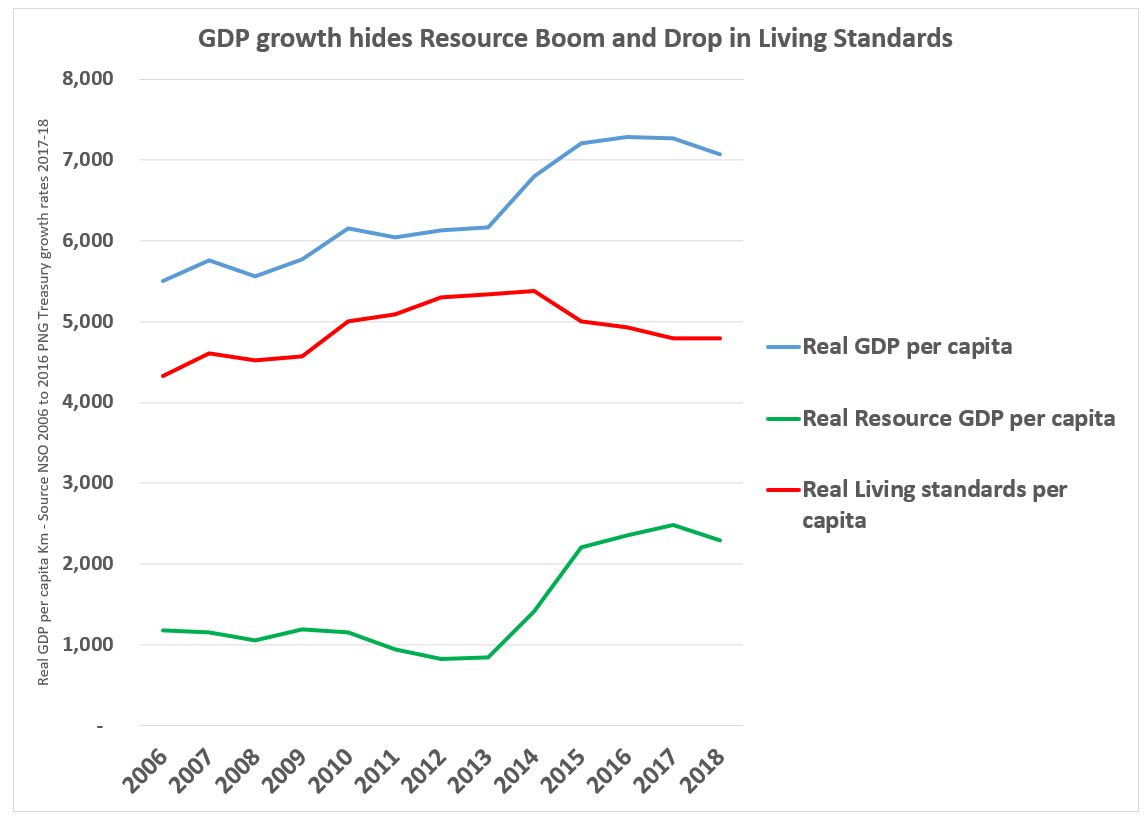
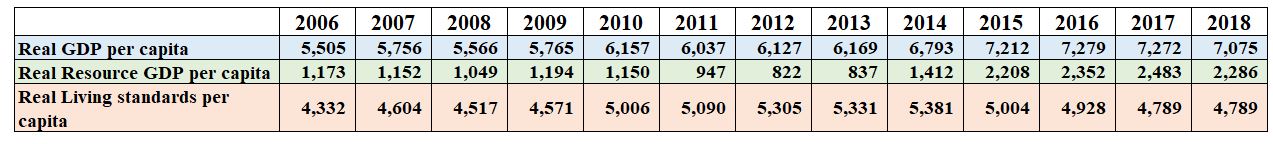
The green line shows real resource per capita. It had been going down slowly from 2006 to 2013, largely reflecting a decline in the output of the Kutubu oil fields and Ok Tedi. The start of the PNG LNG project has had a major effect on this line – more than doubling its level. The resource sector has indeed been booming.

The red line shows the rest of the economy – so the measure for living standards. In contrast, to the resource sector, even after including spill over effects from the resource sector, living standards have been doing poorly in recent years. From a peak in 2014 related to the final elements of the construction phase of the PNG LNG project, there has been a decline of over 10 per cent. This is in contrast to the earlier pattern from 2006 to 2014 when living standards had been slowly increasing.

The blue line shows overall GDP. This line is simply the red and green lines added together. By adding them together, however, and only focusing on GDP, one misses the key issues mentioned above. PNG is a dualistic economy, and in recent years, the resource sector has been booming while living standards have been in decline. This is a classic symptom of the resource curse. Myself and others have discussed the poor fiscal, monetary, exchange and micro-economic settings, combined with corruption and poor service delivery, which both are predicted by and also re-enforce PNG’s resource curse.

The key conclusion behind all the statistics from the recent NSO figures is that PNG needs to start on a new path if it really wants inclusive development.


World Bank PNG Economic Update – Jekyll and Hyde

Executive Summary

The World Bank’s PNG Economic Update released on 7 February is a Dr Jekyll and Mr Hyde act for the PNG government.

The front macroeconomic part is undoubtedly very kind to the PNG government – it resembles the friendly support of Dr Jekyll in the famous Robert Louis Stevenson novella. There is much praise for the government and any criticism is buried away in the middle of paragraphs or implicit in graphs and specific numbers in tables – one must work hard and read between the lines to find what is really going on. One example of the friendly treatment is the very conciliatory discussion of the K3.4 billion breach (“policy deviation”) of the medium-term fiscal deficit targets agreed in the 2018 Budget and made the first condition of the World Bank’s budget support loan in only September 2018. Even allowing for expenditure arrears of nearly a billion kina, K2.5 billion (or 72%) of this massive deficit blow-out from 2018 to 2022 is left unexplained. Overall, what is remarkable in the January 2019 Update is the lack of reference, yet alone analysis, of the seven key issues identified by the World Bank in its own December 2017 Update. In the detailed analysis below, the PNG government has failed to implement its fiscal strategy, revenue strategy, wages strategy and measures to disentangle PNG’s budget fortunes from the whims of international commodity prices. In just over a year, the World Bank has retreated from its own benchmarks.

The second part of the report has a “special focus” on the private sector, and the tone is very different. This is the Mr Hyde part of the report – the local business sector will like it but the government’s efforts over the last seven years are found seriously flawed. Especially under the heading “Removing constraints in the business environment to boost private sector investment”, the government gets a hammering for “a largely unfavourable business environment”. One section is particularly tough on the government’s proposed reserved activity list concluding “the level of business environment risk has been dramatically increased”. The detailed analysis of this second part of the report will be covered in a later article.

As an analyst of these World Bank reports on PNG for over 40 years (my first policy paper in the public service in 1978 was analysing the first World Bank report on PNG after Independence, and my career included some 7 years working in AusAID or Treasury on the World Bank/IMF desk and attendance at many, many World Bank/IMF annual and Spring meetings) this is an unusual report. The current Economic Update must be read in a historic context. The World Bank’s relationship with the PNG government was essentially broken during the structural adjustment assistance of the early 2000s, especially due to the failed land reform program. The World Bank has been slowly rebuilding this relationship through normal project funding, although at a much lower level than the Asian Development Bank. This is the first PNG economic update since the budget support loan taken out in September 2018. There was a need for a public report (indeed, the initial undertaking when the first update was produced in December 2017 was for six monthly reports). The big picture is that the World Bank is extremely worried about PNG’s declining standards of macro-economic management – that is why PNG’s economic management has been seriously downgraded in recent years to a “fragile situation” country according to the World Bank’s governance indicators. So how does the World Bank try to maintain influence in encouraging better policies especially with a history of essentially being kicked out of the country? Its main stakeholder in PNG is Treasurer Charles Abel. One does not publicly criticise his macro-economic performance at this stage if seeking to maintain influence. However, it is quite possible that Treasurer Abel also has some concerns about the extremely nationalistic and anti-business policies of Minister Maru. I suspect the World Bank knew it had a green light to be discuss more openly the challenges facing PNG when talking about the private sector.

In this historic context and seeking policy influence in a country with declining economic management, the report is possibly less surprising. At this new stage of the PNG Treasurer/World Bank relationship, the politics probably meant that a Dr Jekyll (nice to the government on macro-economics) and Mr Hyde (willing to publicly criticise the government on private sector policies) character was inevitable. Much of the rest of this article highlights the chasm between the macro-economic priorities set out in the first World Bank Update and the scant coverage of those issues in the second, presumably because things are not going well. The longer-term requirement, however, is that the World Bank must not only keep the PNG Treasurer happy, it has to maintain its own professional standards around analytical rigour and honesty for on-going policy credibility. In the modern era of geopolitics, one would hope that a distinguishing feature in the value sets being offered between a one-party state political system and a democratic political system is frank, public assessments of what is going on. That is why democracies have (or should have) Auditor-General offices and Public Accounts Committees with public reports. These internal institutions should be re-enforced by independent international institutions such as the World Bank. Looking forward, the World Bank should be more open and balanced in its assessments to support both its international policy advisor role as well a role in encouraging accountable democracies.

Details

The friendly Dr Jekyll – Macro-economics

One would have expected the second World Bank PNG Update to reflect on the key priorities set out in its first Update of just over a year ago. So how did things go? The following paragraphs are straight out of the press release for the last World Bank PNG Update in December 2017.

“The government has initiated efforts to stimulate the economy and inclusive growth through its 100-Day Economic Stimulus Plan. The 2018 Budget, in conjunction with the Medium-Term Fiscal and Revenue strategies, provides further evidence of the government’s intent to strengthen the fiscal framework,” said Michel Kerf, Country Director for Papua New Guinea & Pacific Islands. “Commitments to reinforce resilience to fluctuating commodity prices by disentangling government spending from volatile resource revenues, and plans to establish the sovereign wealth fund are particularly encouraging. Strong efforts must be made to contain wage bill costs, which are straining funds available for key public services”, he added. – https://www.worldbank.org/en/news/press-release/2017/12/05/png-taking-steps-to-reinforce-economic-resilience

Looking at this, there would seem to be seven key elements for a subsequent assessment:

  1. How has the 100 day Economic Stimulus Plan gone?
  2. How has the 2018 Budget intent gone?
  3. How has the Medium-Term Fiscal Strategy gone?
  4. How has the Medium-Term Revenue Plan gone?
  5. How have plans to disentangle government spending from volatile resource revenues gone?
  6. How have plans to establish the Sovereign Wealth Fund gone?
  7. How have efforts gone to contain wage bill costs?

What is remarkable in the January 2019 Update is the lack of reference yet alone analysis of these key issues identified in the December 2017 Update. In just over a year, the World Bank has retreated from its own benchmarks. The next section provides some analysis which should have been incorporated into the January Update.

  1. 100 Day Plan

The 100 day plan is mentioned in one footnote reference (footnote 13 on page 9). Of course, even the PNG Government now calls this the “25 point plan” as the 100 day target set by Treasurer Abel was unrealistic. Did the World Bank analyse progress on the 25 points of this plan? Short answer is no. If it had done so, the answer would have been a very mixed bag indeed. Partly this reflects poor fiscal performance (for example, the plan aimed for a 30% debt to GDP ratio in 2017 but that has now been put off until 2021 and the 2.5% deficit was only achieved by not paying some wages and public works bills in 2017), an excessively ambitious timeframe (for example, it was expected that early works would have commenced on Wafi-Golpu, PNG LNG, and even Western LNG), partly that elements of the initial plan were bad policy (such as the rice import quota scheme) and partly this reflects poor governance performance (such as audited accounts from SOEs not being available and lack of wage controls). There were some achievements, such as securing foreign exchange financing, publishing plans (although issues with quality and implementation), temporary reduction in DSIP and PSIP (then over-ruled by the Prime Minister) and solid progress on a number of donor-funded proposals. More analysis would have been appropriate.

  1. 2018 Budget Intent

The 2018 Budget fiscal target was 1% (using the new measure put forward by Treasurer Abel of the “non-resource primary balance as a share of non-resource GDP”) but this blew-out to 2.7% (or 2.9% using IMF GDP numbers). The 2018 Budget displayed the new Treasurer’s planning heritage as it included three medium-term planning elements (fiscal strategy, revenue strategy and debt strategy). These looked fine on paper, but the challenge in PNG has always been about actual implementation. Assessing implementation against the plans should have been a feature of the report. As it did not do so, the following analysis covers some relevant issues.

  1. The Medium-Term Fiscal Strategy

The Medium-Term Fiscal Strategy (MTFS) is discussed in the January Update including a summary of the 8 key targets. As stated in the latest report “As part of the MTFS framework, the fiscal rules were specified….These fiscal rules were built around a new fiscal anchor, the non-resource primary balance (NRPB) which the government targets to bring to a zero-average balance over the medium term.” So how has the government gone against this new “fiscal anchor”? Short answer, and an uncomfortable one for the World Bank, is that it has not been going well. This is probably best illustrated in the following “Figure 9” from the report. From 2014 to 2017 expenditure has been cut faster than falling revenues so the fiscal deficit had been reduced from an unsustainable 6.6% of non-resource GDP down to 1.6%. The new strategy – as set out in the 2018 Budget and confirmed in the 2019 Budget Strategy released in September 2019 was that this solid black line was going to fall to 1.0% in 2018 and 0.7% in 2019. The graph shows the 2019 Budget estimates those figures have increased to 2.8% and 2.7%, a massive turnaround of K1 billion in 2018 and K1.3 billion in 2019. Remembering that total estimated expenditure in 2019 is just over K16 billion, these are major expenditure blow-outs relative to fiscal targets. When judging how the government was performing against the actual intent of the 2018 budget and actual progress against the MTFS, there is little doubt there has been a major breach of intent. Showing a dotted trend line going down, and not showing the original targets in Figure 9, is another example of the Dr Jekyll, nice person World Bank in this report.

So what possible reasons did the World Bank give for this major breach of 2018 Budget intent and the MTFS? The World Bank’s discussion of this “policy deviation” is possibly most rationally explained by “the renewed focus on fiscal consolidation resulted in a sharp contraction in the fiscal deficit in 2017. However, this drove an increase in arrears, which necessitated a correction in the 2018 Budget”. The figure on these estimated arrears is K948.1 million by the end of October 2018 (a figure provided to the World Bank from the PNG government). Is this a credible explanation? Probably for 2018 – the government received nearly an extra K1 billion from the unexpected increase in LNG prices in the first 10 months of 2018. It is reasonable that unpaid contractor, wage, school, Provincial, District and other bills left over from 2017 received priority call on these windfall funds. This is a feasible explanation for the K994 million blow-out in the MTFS deficit target for 2018. But it does not explain at all the K1,301 million blow-out in the deficit target for 2019, or the K1,106 million blow-out in the following three years.

If this was Mr Hyde (the nasty one) writing this part of the report, they might have stated “The 2017 Budget outcome hid a significant build-up in arrears. Even after allowing for these arrears being repaid in 2018, there has been a slowing in the fiscal consolidation effort under PNG’s new Treasurer Charles Abel. The 2.1% of GDP fiscal consolidation from 2014 to 2016 (6.6 minus 4.5) was greater than the 1.8% fiscal consolidation effort of the new government from 2016 to 2019 (4.5 minus 2.7). From 2018 to 2022, the government has breached its 2018 Budget MTFS targets by K3,401 million. Official PNG government figures on expenditure arrears explains only 28% of this policy deviation.”

This extraordinary and unconvincing discussion of the fiscal consolidation concludes with the following very trusting statement: “The indicative medium-term budget framework for 2020-23 indicates that the government is committed to its MTFS targets for bringing the NRPB to a zero-average level”. Of course, the 2019 Budget Strategy commitments did not last for even two months. And getting the average to the zero level by 2025 (the MTFS target) would just require budget surpluses of K3.6 billion in 2024 and K4.0 billion in 2025 – levels never achieved in PNG’s history. “Now that sounds likely to me” says Dr Jekyll. “Get your head out of the sand” says Mr Hyde.

  1. Medium-Term Revenue Strategy

Given the importance of the Medium-Term Revenue Strategy (MTRS), there is very little analysis of progress. However, Figure 8 from the Update indicates things are not improving as hoped – indeed, the actual non-resource tax effort continues to decline rather than increasing strongly. This is shown by the figures in the yellow parts of the following figure – falling from 15.2% of GDP in 2015 to 13.0% of GDP in 2019. Declining non-resource tax revenues are one of the greatest economic challenges facing PNG. The lack of discussion of this failure, even to acknowledge that the original targets were unrealistic and that these institutional issues take a long time to turnaround, is a major omission. One can only assume this was a deliberate choice.

  1. Disentangling government spending from volatile resource revenues

This objective is strongly linked to items 3. and 6. The reason for moving the main budget deficit target to the “non-resource balance” is exactly this objective of disentangling expenditure from the resource volatility. This new objective excluded resource revenues from the base – they would go into the Sovereign Wealth Fund (SWF) or used to repay debt. However, as covered in item 3, the government has completely abandoned this objective for 2019 and spent all of the expected windfall LNG revenues. With oil prices now well below their level at the time of the 2019 Budget, the government has likely gone and spent money it is now unlikely to receive.

  1. Sovereign Wealth Fund

How have plans to establish the Sovereign Wealth Fund gone? Badly. In part this is because the government has spent the LNG revenue windfall of 2018 (and expected for 2019). The only mention of the Sovereign Wealth Fund in the entire report (apart from it being mentioned three times in the reproduction of the MTFS) is in the discussion of “downside risks” where the World Bank simply states “To strengthen fiscal and debt sustainability the government should adhere to the adopted non-resource primary fiscal balance as a fiscal anchor and operationalise the established sovereign wealth fund”. Bottom line is that it has not been operationalised.

  1. Public service wage costs

Public service wage costs are taking an increasing proportion of the government’s budget. In 2016, there was a K470.1 million over-expenditure. The 2017 FBO released in March 2018 indicated the over-expenditure had dropped to only K113.2 million relative to the 2017 Supplementary Budget, and an overall K354.8 million (or 8.8%) higher than the 2016 actual. However, the 2018 MYEFO indicated the government had carried forward excess wage costs from 2017 of at least a further K417m (paid on 4 January 2018 and described as “to offset salary overrun” – p93) – so the 2017 wage over-run was in fact worse than 2016, a fact hidden by the 2017 FBO . In addition, the major expenditure increase in the 2018 Supplementary Budget was an extra K0.6 billion in wage costs – lifting 2018 wage costs estimates from K4.1 billion to K4.7 billion. Even then, the PNG opposition claims the K4.7 billion figure is understated by K0.4 billion based on the government’s own public service expenditure review committee. This is not a picture of wage costs being brought under control. There are some positive signs that some agencies are finally being amalgamated, but overall, there remains a huge gap between the rhetoric in this area and action.

APEC costs – An aside

The friendly Dr Jekyll characteristics of the first half of the report extends to comments on the costs of APEC. It uses the formal budget figures for APEC of K715 million, adds in the APEC Haus tax credit of K120 million, then notes some extra bilateral support, and concludes using the Post Courier as the authoritative source that “the total cost for hosting APEC events is estimated to be about K1 billion”. The basic arithmetic suggests the total level of external bilateral support for hosting APEC was K165 million (K1 billion less 715m less 120m).  Mmmm, all those Chinese funded roads. Australia says its spent AUS130 (K310 million) on security support alone. Add US, New Zealand and other support. Add the various infrastructure facilities upgraded for APEC such as the international airport. Add in all of the other costs carried by usual departmental budgets. Given sensitive political perceptions around “Maseratigate”, the World Bank should not have put its name to such an inaccurately low figure. This is one of the clearest signs of the World Bank being focused on relationship building with the Treasurer, and possibly to help correct some of the political pain caused to the Government with an earlier IMF report simply reporting an initial PNG government estimate that APEC costs would exceed K3 billion.

Debt strategy

The PNG Government is in breach of its debt strategy. The World Bank report includes figures showing gross public debt to GDP will exceed the ceiling of 35% of GDP from 2017 to 2021. This is part of the game being played around GDP figures – discussed in greater detail in earlier articles.

5% growth rate – statistical bounce vs underlying performance

The World Bank is predicting a GDP growth rate of 5.1% in 2019.  In understanding this figure, one needs to understand three characteristics of GDP growth rates. First, and this is the key issue in understanding what is happening in PNG’s dualistic economy, it is vital to separate out how the non-resource sector is going (this is the part of the economy which employs over 95% of the population) from how the resource sector is going (of most relevance to overseas investors apart from tax revenues). The non-resource sector is expected to grow at 2.4% in 2019, essentially the same as in 2018 (2.3%). This is less than the official population growth rate – so incomes will continue falling in real terms per person. Second, growth rates are an annual measurement. So 2018 was a bad year for the resource sector because of the tragic earthquake – and non-resource growth was minus 2.0%. Simply getting back to where things were in 2017 would have meant a positive growth figure of over 2% – but this simply reflects the statistical “bounce” from an annual growth figure. If a two year time horizon is used, the resource sector has grown by 0.3% per annum since 2017 and the non-resource sector has grown by 2.3% per annum. So the underlying growth path is still low – the 5.1% figure is the inevitable statistical bounce. Third, some commentators have suggested the increase is due to higher commodity prices. This is a common mis-perception.  Real GDP aims to take out all price effects – so the increase in oil and LNG prices is actually taken out of the real growth in underlying production levels. There can be second round effects (such as higher commodity prices increasing government revenues which increase expenditure which can lift GDP growth rates).

Conclusion

As noted above, the January 2019 World Bank Update is remarkable in its lack of reference yet alone analysis of the seven key macro-economic issues identified in the December 2017 Update. In just over a year, the World Bank has retreated from its own benchmarks. APEC cost figures add to this picture of the World Bank being at worst a spokesperson for the O’Neill government, at best simply being a friendly Dr Jekyll. The historic context suggests this Update is primarily about building a positive relationship with PNG’s Treasurer, Charles Abel. It certainly is not a report carrying the policy judgements and analytical rigour one would expect from the World Bank. A short-term focus damages the World Bank’s longer-term credibility.

PNG Economic Statistics Corrupted – Responses to Treasurer

The PNG Treasurer has provided inadequate responses to recent coverage of the corruption of PNG’s economic statistics.

Late on Saturday evening I was surprised that PNG Treasurer Charles Abel was responding directly on Facebook to my recent blogs on this issue. The front page of PNG’s weekend paper, the Sunday Bulletin, which featured with the heading “Economic Statistics Corrupted”, possibly contributed to the direct Facebook comments from the Treasurer. Later Facebook coverage highlighted an earlier response from the Treasurer.

Democracy thrives on discussion and debate. I congratulate ‘The Sunday Bulletin’ for being brave enough to cover the issue. The story is not “fake news” and the report from PNG Economics covering the issue, supported by analysis from other independent think tanks and universities, was worthy of a news article. However, in an environment where there is clear pressure on the PNG press not to cover unfavourable stories about the O’Neill/Abel government, I can imagine the ferocity of the phone call from a certain advisor in the Prime Minister’s office and the threats that could be made.

Following are the two responses I have from the PNG Treasurer, and my responses provided on Facebook over the weekend. Putting these in a single article will hopefully allow the discussion to continue – possibly allowing for some honest reflection on how to make for better statistics to inform better policy in PNG.

The two key elements of my responses are:

  1. As the Treasurer indicates, the rules for calculating the size of the economy (GDP) were significantly changed. However, these changes occurred in 2017 and the government was very happy with these new rules covering the first eight years (2007 to 2014) which led to major increases in measured GDP. They immediately built the new figures into their economic policies. However, using the same rules, the 2015 figures published in March 2018 were politically inconvenient for they showed the non-resource economy in a severe recession (negative growth) and risked breaking the legislated debt to GDP target. The Treasurer only cries foul and sends the rules off for further examination when they don’t suit his political story. If the 2015 GDP numbers was the first release under the new rules then I could understand the argument. But to only object to the ninth year indicates other motives.
  2. The Treasurer tries to validate his approach by referring to the support from the IMF and ABS, and implying that they agree there is a major problem. However, the ABS has quietly walked away from the fiasco and latest reports indicates it has suspended its technical assistance report. The IMF continues to release the original numbers from the NSO/ABS/IMF March 2018 report despite requests from the government not to do so. The Treasurer’s international friends have left him on this issue. They don’t like getting involved in what amounts to the corruption of PNG’s statistics.

Following are the two complete Facebook discussions covering the statistics. I’ve included comments from others that also participated. The first response was immediately following my fourth blog exploring the four motives behind the corruption of PNG’s economic statistics. The response covers two paragraphs and I respond separately to those. The second response from Abel was included as as “conversation starter” on Paitum Garamat on Sunday 3 February. It included the front page of the Sunday Bulletin. I’m not sure when Treasurer Abel made the specific comments or which article he was responding to – but they have been relayed to me from several sources.

1. Treasurer Abel’s response on Facebook (Sharp Talk Saturday 2 February).

Charles Abel Paul there is no deliberate attempt to manipulate numbers. In fact we are working closely with the IMF and the World Bank in many dinancial reforms. This has resulted in a graduation back to budget support modality funding and a successful inaugural sovereign bond issue.

The IMF has changed the method of GDP calculation. Preliminary application of this method by the NSO has created a discrepancy with the Central Bank and Treasury numbers. Queries of the application by NSO have lead to acknowledgement by the IMF and ABS that the queries have basis and proper consultation is required before rule changes like this are finalised. The NSO results are preliminary and final numbers will be published in February with the support of the IMF and Australian Bureau of Statistics.

Paul Flan Dear Treasurer. Thank you for responding as an exchange of ideas and perspectives is good for democracy. With the utmost of respect, your opening paragraph fills me with concern (I will comment on the second paragraph shortly). Of course, there have been attempts by the IMF, World Bank, ADB and others to try and reverse the decline in PNG’s economic management – a decline documented in ratings over recent years that have moved PNG into being classified as the only APEC “fragile situation” state. However, it would seems as if this assistance is being given lip service at one level, but then ignored when faced with the realities of politics. The clearest example of this was your change to the Fiscal Responsibility Act in 2017 to move the primary budget deficit target to an average of zero (over the medium-term) of the non-resource fiscal balance as a share of non-resource GDP. Agreement was given to the budget support loan on the basis of this target being included in your 2019 Budget Strategy – and before your 2019 Budget figures were actually released. However, your 2019 didn’t deliver on this commitment. This was not a slight deviation – it was close to a billion Kina of additional expenditure over what you had committed to as the first priority when PNG received the assistance. There appears to be a track record for asking for assistance, accepting it when convenient, but then over-turning it during the rigour of the budget process. I discussed this characteristic of your last two budgets in a recent edition of the East Asia Forum.

Nelson Kopunye I heard about this on Radio Australia the other day

Paul Flan In response to your second paragraph, I just highlight that three earlier articles (see pngeconomics.org as well as on Sharp Talk) have gone into some additional background. When responding to a similar explanation as provided in your 2019 Budget, I asked the question as to why the Treasury and Central Bank where happy with this changed methodology which covered 2007 to 2014? Why were they happy with the first eight years of changes, but unhappy with the ninth? Yes there was an updated methodology and this had dramatic impacts in portraying the government’s performance – the move from the orange line down to the red line. Everyone seemed happy with this massive initial change. However, when the same methodology produced an inconvenient number, it is not used, a committee is set up to examine the issue six months after the draft release, and it seems possible that updated numbers will be released nearly one year after the initial draft was released. Anyway, your last sentence indicates that the ABS has returned to help with the updated figures. Could you please just confirm that the ABS has lifted its suspension of working with the NSO which the IMF documented as recently as December? With respect and always happy to discuss further.

2. Treasurer Abel’s response copied on Facebook (Paitim Garamat Sunday 3 February)


Cent Marak shared a post.

Conversation Starter · 4 hrs

Trex Kalik‎ to Alotau District

Wehley George Kanari Wow Incredible Stats

Aloysius Maneo Not surprising though ..its a fact.

Matthias Lasia ValeRius I hope UnABel and PO will not say Fake News ✌✌😜😜😜

Cent Marak I’ve responded to this many times already. Its a claim by Paul Flanagan in Australia. IMF changed the ground rules for calculation of GDP recently and the NSO rushed to publish some preliminary numbers showing a discrepancy with the numbers from BPNG a…See More

Daoni Esorom Cent Marak . It just shows yet again the lack of coordination and communication between key government departments and institutions on key issues so pertinent to the management of the country’s economy. This time key government departments not communicating on key economic formulas. This time NSO gets the blame. Next time it will some one else. So damaging though. And it’s certainly won’t be the last. Expected in governments with weak systems like ours where blame and lieing is the norm. So typical of PO-Abel government.

Cent Marak Daoni Esorom that’s the response from our DPM

Daoni Esorom Cent Marak. The DPM response does not reflect the realities and the truth. I will believe an economist and not a singer cum MP. You take your pick.

Paul Flan Hi Cent. Thanks for posting – as I’m banned from the country by the Prime Minister for suggesting that the fall in oil prices in late 2014 would affect the budget (that was met with accusations of fake news, LNG contracts were at fixed prices and there would be no impact on the budget – unfortunately, I was right again on that one) I don’t get to see the Sunday Bulletin anymore. Anyway, I had a similar discussion with the Treasurer on Sharp Talk late last night. I am copying that below and will post also on the pngeconomics website and facebook page:

[Complete copy of the first conversation was placed on Facebook – not repeated here for the sake of brevity – except that I included an introduction to the extract from the IMF report indicating the ABS had pulled out]

Paul Flan This is an extract from the latest IMF report – it indicates the ABS is no longer supporting preparation of a response to new GDP numbers. This was probably the final straw, along with the very poor attempted explanation in the 2019 Budget, for deciding to call the GDP games as a corruption of PNGs Statistics.

Paul Flan And Cent, if you want to use a football story, the facts are that the rules were changed and accepted by the O’Neill/Abel team for the eight years 2007 to 2014. The O’Neill/Abel team really liked the new rules and quickly scored eight tries as it made their economic management look better. Then the other team scores two tries under the same rules and the O’Neill/Abel side now decide to dispute the rules in a show of bad sportmanship. One umpire, the Australian Bureau of Statistics, has left the field in disgust. The other umpire (the IMF) is still saying the 2015 and 2016 numbers are valid in all of its publications. O’Neill/Abel have now gone to the video referee – and we all know what pressures and incentives that can bring. All other economic indicators for 2015 indicated there was a severe recession in the PNG economy outside of the resource sector – employment was falling, business sales were falling, tax collections were falling (due to falling incomes, profits and consumption), imports were collapsing, private sector investment was suffering and there was the worst drought in 20 years. Just accept the facts based on new rules that everyone accepted because the new rules were actually better in measuring the size of the economy. The government shouldn’t cry when the new rules don’t bring the facts that they want – just accept the new facts and try and create better economic policies for the people of PNG.


Matthias Lasia ValeRius Paul Flan thank you Paul 👍😀

Cent Marak Thanks Paul… Taxpayers deserve to know the truth

Daoni Esorom Cent Marak ..And politicians must not lie to the masses including those who know more than them.

Soctinec Sophin Malakhu Wow, very brave reporting.

Vincent Agi Omi Wow… The mysterious mysteries..

James Masa Tell the truth! People are dying because of lack of medicines. Hiw dare you ride on people’s suffering?

The motives: Why would the O’Neill/Abel government want to manipulate economic statistics (4)

Earlier articles have covered the facts around the corruption of PNG’s GDP statistics and found a false alibi for this economic crime. So what are there possible motives? Four motives are explained below.

The first and primary political motive is the inconvenient fact that the updated PNG National Statistical Office (NSO) figures, supported by the Australian Bureau of Statistics and the IMF, show the non-resource parts of the economy had been in recession in 2015 and 2016. As well over 90% of the PNG population derive their livelihoods from the non-resource sector (especially agriculture), it is vital to focus on the non-resource sector when determining how things are actually going for the people of PNG. So a recession extending over both 2015 and 2016 in the non-resource sector is a major issue, including a political one. While much of the economic decline was the inevitable end of the construction phase of the PNG LNG project, admitting a severe recession extending over two years would hurt the government’s economic credentials and leave it open to further charges of economic mismanagement.

Second, economic growth rates have become a political issue in PNG – the Opposition is calling for a commitment to move to a 5% non-resource GDP growth target. One easy way to manage such a call is to take control of the growth statistics and simply boost them up.

Third, there are more subtle impacts from using a higher GDP number, even if a fraudulent one. This is illustrated in the following chart. The chart uses official GDP debt levels contained in the 2019 and earlier budgets for all three lines – so the only variation is disagreement about GDP levels. The top orange line shows the situation using the original PNG Treasury numbers – so before the 2017 NSO update. Projected debt levels were going to keep the debt to GDP ratio above the limit set in the law of 35% (under the Fiscal Responsibility Act). This would have been politically embarrassing. Holding the debt to GDP down would have required a lower budget deficit, requiring less spending or more taxes. Since the 2017 election, there has been little appetite for constraining expenditure – there have been very large increases in expenditure in Treasurer Abel’s first and second budgets.

With the initial 2017 NSO update, PNG’s debt to GDP ratio almost magically resolved itself, falling to the red line. Lifting the nominal GDP figures means the debt to GDP ratio decreases – one is dividing by a bigger GDP number which allows for more debt at any particular ratio. There was now the option to spend more without breaking or amending the law. This was a very convenient solution for the government and avoided immediate pressure on the PNG Treasury to cook the GDP books – they could use the NSO figures up to 2014 and then grow GDP forward at reasonable rates to solve the debt to GDP – shown by the red line.

However, the subsequent March 2018 figures from the NSO put an end to this easy solution – with the new situation shown by the green line. The new figures for 2015 lifted the debt to GDP ratio from 29% to 32%. But an even greater worry was that the lower base and realistic growth rates meant that from 2016 onwards that the government had been breaking the law with a debt to GDP ratio exceeding the 35% limit. Although the government has the numbers to simply lift the ratio higher, this could reflect poorly on its international reputation. It could also lead to calls for better indicators for debt fragility such as looking at debt interest costs to revenue ratios (PNG’s are very high for developing countries while its debt to GDP ratio is relatively low).

In summary, the orange line was a problem. The red line was an initial solution – both more accurate figures from the NSO/ABS/IMF, and very convenient for dealing with the debt to GDP ratio. The new green line is now the problem – the updated figures from NSO continued to be accurate, but they were no longer politically convenient.

Fourth, higher nominal GDP figures have other indirect gains. In the same way as they lower the debt to GDP ratio, they also lower the budget deficit to GDP ratio. This gives the impression the budget is more under control. The GDP ratios can also be useful when making historic comparisons to economic performance prior to 2006. This is because the NSO update in 2017 lifted the nominal level of GDP by nearly 50% for 2006 and at least 30% through to 2014. However, it didn’t update its pre-2006 numbers. So debt to GDP and deficit to GDP figures look much, much worse in the times prior to 2006 simply because GDP estimates have not been updated, and this helps make the current government look better. Higher GDP figures are also likely to feed into higher estimates of government revenues as many GDP elements such as wages and profits and consumption are directly linked to tax collections.

Conclusion

Pushing the 2018 NSO/ABS update off to a committee and using the government’s own GDP numbers is hard to interpret as anything other than corruption of PNG’s most basic economic measure. The ABS appears to have walked away from the issue – an understandable response to help protect its professional integrity.

The final sentence in the “explanation” for the difference in GDP figures (discussed in the third article in this series) concludes:

In the meantime, all stakeholders including donors are urged to use official estimates of the National Accounts produced by Treasury especially for the years 2015 to the current year and until the new 2015 National Accounts are released.

Hopefully, this will not be done. There is a pretty clear truthful statistic for nominal GDP in 2015 – and that is not the one being used by the PNG government. There are very limited channels to try and limit the level of growing political corruption in PNG. There was a chance to make a more forthright set of comments about the 2017 election, but Australia clearly failed in that area.

Hopefully other donors can follow the lead of the IMF and other independent commentators in not simply accepting the economic narrative from the PNG government which is increasingly being based on manipulated economic and budgetary statistics. PNG’s institutions will struggle to turn the economy around when it is so far off course and its economic compass of genuine statistics has been so seriously corrupted.

The false alibi: the government’s lamentable explanation for its false GDP figures (3)

This is the third of a four part series covering the corruption of PNG’s economic statistics. The government has failed badly in trying to explain why they were using false nominal GDP numbers. They blame a change in a “Price Index”. But this excuse is farcical because you don’t even use a price index in determining nominal GDP.  A price index is used in measuring real GDP – but even then the NSO/ABS/IMF new price index was accepted for all the years 2007 to 2014. The price index was only questioned when the facts didn’t suit the economic narrative of the O’Neill/Abel government.

This article sets out in full the government’s attempted explanation for the mismatch in the PNG’s GDP numbers – I didn’t want to be accused of not fully representing the government’s excuse. Assessments are then made of the key arguments. This makes for a long article but some detail is required to justify why it is the final straw for judging that PNG’s economic statistics unquestionably have been corrupted.

The 2019 Budget included a very interesting box on the GDP figures (Bottom of Box 2, 2019 Budget Volume 1 pp 27-28). The following paragraphs provide the full government explanation in italics followed by a response.

The National Statistical Office (NSO) is the agency responsible for the collection and compilation of statistics including economic data and the compilation of PNG’s National Accounts. The office is currently in the midst of a reform period (2015-2019) with assistance from the Australian Bureau of Statistics (ABS) providing the Technical Assistance following NEC Dec 162/2014 for the overhaul of NSO. Several milestones have been achieved from this reform program, including the timely release and update of the National Accounts 2007-2014 in 2017 which updated the outcomes of GDP for that period which had remained outdated for more than a decade. While this demonstrated much of the progress emanating from the reform activities, more needs to be done before NSO can fully function on its own. In this regard, Treasury and the BPNG have been continuously supportive of the reform process by providing timely assistance in terms of data validation based on economic data provided by NSO through constant collaborations since the start of the reform process.

This background information includes a dangerous half-truth. The latest IMF Article IV report released in December 2018 indicates that the ABS is no longer providing technical support: “however, the ABS recently suspended its program due to increasingly uncertain NSO leadership and management, which threaten its current operations” (IMF 2018 Article IV p10). The ABS has walked away.

According to the 2019 Budget, what now is the problem with the NSO update?

“In 2018, NSO, Department of Treasury and BPNG, continued this process during the preparation of the 2015 National Accounts. During this stage, Treasury and BPNG observed a major change or shift in the methodology of compiling the national accounts. This included the use of a Composite Price Index as the new deflator replacing the Consumer Price Index (CPI). This caused a significant variation in the 2015 National Accounts prepared by the NSO compared with the official estimates produced by the Treasury (see below): 

Because the change in methodology was something new and since it caused some anomalies in the accounts, the Treasury and BPNG advised NSO to refrain from publishing the 2015 National Accounts until it was comprehensively understood and all associated anomalies from it were reconciled. Unfortunately, NSO proceeded to publish the 2015 National Accounts during the year without addressing the outstanding issues.

This is an absolutely extraordinary explanation.

First, yes, the table above does show the difference of K5,021 million between the “NSO Composite Price Index” and the “Treasury Consumer Price Index”. But a price index has no impact on nominal Gross Domestic Product – it is a total non-explanation dressed up in technical jargon. In basic economics, one learns the clear difference between “nominal” and “real” GDP. Nominal GDP does not take into account price changes through time while real GDP does. So a difference between price indexes (composite vs consumer) can affect measures of real GDP, and especially real growth rates. However, by definition, they have no impact on nominal GDP figures. The K5,021 billion gap is a nominal GDP difference. Price indexes do not change nominal GDP calculations. This attempted explanation is farcical.

Second, any concerns about the price indexes did not apply to the NSO 2017 release of updated information. The complete set of those tables, from 2007 to 2014, were immediately incorporated into Treasury’s GDP tables (although with some technical glitches, but there was no discussion of problems with any of the new methodology). So there was quick action in accepting the first eight years of updated information (2007 to 2014). The issue only occurred for the ninth year (2015) and probably 2016.

Third, going beyond the vital but simple technical issue that nominal GDP is not affected by price indexes, could there be a significant difference between a composite and a consumer price index? Short answer is that the PNG Treasury doesn’t actually use a “consumer price index”, and the NSO change is unlikely to have a significant impact on the deflators used in PNG’s national accounts. More specifically, PNG Treasury had been using for many years several deflators depending on the sector of the economy (which is what should happen). So the mining sector had its own price index to reflect changes in international minerals prices as did the petroleum and gas sector. The agriculture sector also had its own price index to reflect changes in international agriculture prices such as coffee and oil palm and forestry. All three of these price indexes are dominated by changes in international prices, not changes in the consumer price index. As these sectors together accounted for over 40% of GDP, it is difficult to describe the Treasury index as just a “consumer price index”. It clearly is a composite index of the CPI and international price movements. There is not much information on the other “composite price index” produced by the NSO. The original NSO update talked of using “constant purchaser prices”. Unfortunately, there is no public information on this index including on the NSO website. However, as mentioned above, this NSO index has been used by the PNG government for all of its GDP figures over the previous eight years and is the basis for the PNG Treasury numbers in the 2019 Budget from 2008 to 2014 – the deflators for each of the sub-sectors in Table 1 of Appendix 3 of Volume 1 of the 2019 budget are identical to those of Table 15 in the NSO publication PNG National Accounts 2007 to 2014. And as stated at the beginning, the key issue is that these price indexes do not affect nominal GDP anyway. They could affect real GDP growth calculations – but generally only by a small amount. The baby was thrown out with the bathwater in a very convenient outcome for the government.

The final element of the official explanation is below.

In view of this, Treasury and the BPNG, including the NSO, established a working committee in September to evaluate the 2015 National Accounts and address all the anomalies before releasing the final accounts again. This work is in progress and will also assist to establish the foundations for the publication of the 2016 National Accounts and the forward years national accounts projections.

It seems extraordinary that it took six months to decide to form a committee to try and resolve this massive difference in GDP estimates (9 March 2019 for the initial NSO release and September before the committee was formed). The PNG Opposition was querying the GDP figures by this time, along with the UPNG/ANU economics update (see here and here), so presumably there was some demand for action.

Sir Humphrey Appleby from “Yes Minister” fame would be pleased that the resolution to this political issue was to call for a committee!

Conclusion

This article goes through in considerable detail the full government’s explanation of the GDP figures mis-match. However, as assessed above, this attempted explanation fails miserably. Indeed, it is so filled with half-truths and blatant errors that it is the final straw in the formation of the view that PNG’s economic statistics have been corrupted. It is one thing to make an extraordinary technical error in the employment figures in the 2019 Budget (see here). But there is such a clear pattern of convenient erroneous numbers that one can only conclude PNG’s statistics are now being manipulated for political purposes. This pattern of corruption is likely to continue to slowly seep through other statistics, especially as there do not seem to be any good governance checks on what is published. My next article will explore in greater detail the possible motives for the corruption of PNG’s economic statistics.

PNG’s GDP facts – the economic corruption (2)

This is the second of a four part series covering the corruption of PNG’s economic statistics. A summary of the analysis was released yesterday. This section covers in detail the facts around the corruption of PNG’s estimates of Gross Domestic Product (GDP) – the measure of the size of the economy. Tomorrow’s section will cover the government’s false alibi, and the final section will cover the government’s motives for this economic crime.

The following graph provides the latest economic forecasts of GDP by the PNG Government (sourced from the 2018 and 2019 Budget documents), the National Statistics Office (for 2013, 2014 and 2015) and the International Monetary Fund (from its latest economic survey of the PNG economy published just last month).

There are several features of these figures.

Historical agreement

There is complete agreement on GPD measures from 2007 to 2014 estimates – so although the graph only shows from 2013 onwards, the agreement goes back to 2007. The NSO produced in 2017 up-dated GDP reports covering the period from 2007 to 2014 for all sections of the economy providing nominal estimates, and relevant price indexes to determine real growth patterns (an earlier release covered the period 2006 to 2013 but didn’t include price indexes). The PNG Treasury and BPNG fully agreed with the NSO’s update of GDP statistics from 2007 to 2014 including the new price indexes (this is an important fact for the next article covering the government’s “alibi”). This NSO work was important for understanding the actual performance of the PNG economy. The NSO’s economic section had not produced any GDP figures since 2006 – bad for economic policy in PNG and in breach of PNG’s formal obligations for being a member of organisations such as the World Bank. Fortunately, back in 2016, the NSO agreed to partner with the Australian Bureau of Statistics (ABS) and the IMF to start producing this most basic economic statistic once again . This new collaboration also allowed better methodologies to be used. With the agreement from all for the figures from 2007 to 2014, things were once again on track and going well.

The 2015 divergence

The columns only begin to diverge in 2015. The NSO released a report on the measure of GDP for 2015 on 9 March 2018. This NSO report calculated nominal GDP had grown by 0.7% in 2015, well below the 9.8% estimated by PNG Treasury. The NSO’s lower figures were no surprise. Other economic measures clearly indicated PNG’s non-resource sector was in recession in 2015 – PNG was in its worst drought since 1997 which was hurting both the agriculture and mining sectors; businesses were reporting sales down 10 to 20%; employment levels were dropping; tax collections from wages and profits were in decline; and the value of imports was plummeting to levels of a decade earlier.

The graph indicates the IMF accepted the new NSO figures for 2015. However, the PNG Treasury broke with tradition and refused to accept the NSO numbers. They refused for the MYEFO update in July 2018 (without explanation), the 2019 Budget Strategy in September 2018 (without explanation), and in the 2019 Budget itself (with an unbelievable explanation discussed in the next article). The Treasury is still claiming the economy is 9% larger in 2015 than its own NSO office, with the assistance of the ABS and IMF, has calculated. The next article will cover the ABS recently walking away from this mess.

Growing divergence from 2016

There are no publicly available official numbers from the NSO after 2015 – although they had apparently nearly completed the 2016 update (the IMF reports the figures had been “drafted but not published”). The IMF would have had access to the NSO’s /ABS’s 2016 estimates, and it is likely they are included in the IMF figures. Once again, PNG’s non-resource sectors (which include agriculture, construction, wholesale and retail trade, finance, government, community services, transport, communications – so the vast majority of the economy on which the economic welfare of PNG citizens depend) is estimated to have been in a mild recession in 2016 with a negative growth rate of -0.1%. Building on a non-resource recession in 2015 with a negative growth rate of -3.1%, this was clearly going to be embarrassing for the O’Neill government, highlighting that it had not put in place a continued growth strategy following the inevitable end of the PNG LNG construction phase. The government’s response was that in addition to the 9% over-estimate in 2015, another 5% over-estimate was added in 2016 – lifting the overall gap between the government’s figures and the IMF (likely NSO/ABS figures) to 14%.

The gap continues to grow as the PNG Treasury has also broken with tradition and is now including into its forecasts assumptions that particular resource projects will go ahead even prior to a final investment decision being made. Such an approach is known to be dangerous – it is called the “presource curse” (see here) where assumptions about unconfirmed future resource projects are built into government models, thereby generating assumptions about increased revenues, which are then often spent. This phenomena is also known colloquially as “counting the chickens before the eggs are hatched”. The O’Neill/Abel government is also forecasting very, very strong economic growth rates in future years. For example, for 2022, the IMF estimates growth will be 3.3% in real terms for the non-resource economy. This is the same figure used by the PNG Treasury in the 2018 Budget. 10 months later, the PNG government forecast the growth rate would be more than double this rate at 6.9%. Only two months later, the government’s growth rate forecast increased even further to an extraordinary 9.7% – nearly triple the IMF rate and triple the rate included in the 2018 Budget of Treasurer Abel.

These assumptions about much higher growth rates build on the earlier “base” issues for 2015 and 2016. By 2023, the difference between the O’Neill/Abel 2019 Budget estimates and those of the IMF have risen to K31.8 billion, or 34% of the economy. The build-up of these differences is shown in the graph below, with the percentage gap shown in the blue columns and left-hand axis (identical to the graph shown in the executive summary) and the gap in Kina billions shown in the orange line relative to the right-hand axis.

Conclusion

Such massive differences in understanding how the economy is performing is not just a simple difference in statistics. Good statistics can help better understand what is going on, and possible good policy options – they provide an economic compass. For example, by acknowledging the economy was really struggling in 2015 and 2016 might have encouraged a faster response in dealing with the 2015 drought as well as earlier action to correct the foreign exchange problems. There were other indicators of these problems, but admitting that there is an actual economic recession can galvanise government action faster and in a more focused way. Unfortunately, PNG has thrown away its economic compass. Without a good compass, it will be much harder for PNG to turn the economy around from current mismanagement. And as poor economic management costs lives through lower wages, higher prices, and fewer basic services, such a blatant corruption of the figures is an economic crime.

The corruption of PNG’s economic statistics – Summary

Summary

PNG’s economic statistics have been corrupted.
Even the most basic economic statistic of “how big is the PNG economy” has been manipulated to tell stories convenient to the O’Neill/Abel government.
An extra-ordinary gap of 18% (so nearly one-fifth) has opened between the PNG Government’s measure of the size of the economy (economists call this “Gross Domestic Product” or GDP) and independent outside observers led by the International Monetary Fund. Half of this gap emerged in 2015 when PNG’s own National Statistics Office (NSO), with assistance from the Australian Bureau of Statistics (ABS), said the economy was actually 9% smaller than claims by the PNG Treasurer.

The gap in this most basic economic measure is 34% (or one-third) by 2023. Specifically, the PNG Government claims the PNG economy will reach K125 billion while the IMF estimates it will more realistically reach 93 billion in 2023. The difference is driven by the IMF using the actual NSO GDP estimates for 2015, and doubts about the O’Neill/Abel governments claimed rate of PNG’s economic growth.

The NSO 2015 GDP figure was released on 9 March 2018. This date marks the clearest point from which the government started manipulating statistics – although there have been questionable practices in the past. The initial NSO release only included high level GDP information but indicated more details would be provided shortly. This never happened. Apparently, also with ABS assistance, 2016 GDP data was also prepared. This also has not been released.
The official attempt to explain the 9% difference in 2015 is lamentable and filled with basic errors. The blame is put on a new “price index”. However, one does not even use a price index when determining nominal GDP and the 9% gap is in nominal GDP. A price index is used for determining real GDP and differences in price methodology can have an impact. However, the government had been happy to use the new NSO price index for the eight years 2007 to 2014 when it was politically convenient. They just didn’t want to use the same price index for the ninth and tenth years of 2015 and 2016 when the results were politically inconvenient (details below).

The government has used the involvement of the Australian Bureau of Statistics (ABS) to boost its own economic credibility – and it did so again in the 2019 Budget. However, when discussing ABS support for better GDP figures, the IMF notes “however, the ABS recently suspended its program due to increasingly uncertain NSO leadership and management, which threaten its current operations” (IMF 2018 Article IV p10). Given recent practices over the last year, this would seem a sensible approach from the ABS – there was a need to walk away to protect its own integrity. The International Monetary Fund is using the NSO figure for 2015 and presumably for 2016 – a fact that must greatly irritate the O’Neill government.

So why would the O’Neill/Abel government want higher GDP figures than those provided by the NSO and ABS? Higher GDP figures are extremely convenient for the government. Specifically:

  • • A higher GDP figure avoids the embarrassment of admitting PNG had a serious recession in the key parts of its economy in 2015 – and a mild recession in 2016;
    • A higher GDP figure hides the fact the government is breaking the law by having a debt to GDP ratio higher than 35%; and
    • A higher GDP growth figure in the out-years counters the PNG Opposition’s call for an improvement in PNG economic growth rate.

The growing errors and half-truths in PNG’s economic statistics can no longer be explained away simply by technical errors. The pattern is now clearly one of manipulating figures to fit the government’s economic narrative. The credibility of PNG’s economic statistics – whether the size of the economy, economic growth rates, employment levels or budget outcomes – has plummeted. Let’s now call a spade a spade – the corruption of PNG’s political system has spread to its economic statistics.

The more detailed analysis will be published over the next three days in three articles:

  1. The GDP facts economic corruption;
  2. The false alibi; and
  3. The motives.

I now predict that official PNG government figures will indicate, no matter what the actual truth, that the 2018 budget outcome exceeded its targets and that growth will become more positive. The government’s internal, overly optimistic narrative based on false figures will limit action on underlying economic issues such as a mis-priced exchange rate, poor micro-economic policies such as growing protectionism, dangerous approaches towards increasing foreign commercial debt to over 50% of its public debt, and ignoring business concerns about the 23 January anti-investment business regulation.

Greece went down a similar path of manipulating its economic statistics to hide growing budgetary and other problems from Brussels. It did not end well. Given its current leadership, possibly it is not that surprising that PNG is heading down a similar slippery slope where statistics give way to political convenience. I fear the outcomes will be worse than the Greek experience. PNG’s institutions will struggle to turn the economy around when it is so far off course and its economic compass of genuine statistics has been so seriously corrupted.