Summary
PNG politicians are failing their people. Their poor policies have led to dramatic declines in economic well-being – an extraordinary fall of over one-third since 1980.
This is revealed by applying new numbers from the PNG National Statistics Office (NSO) and International Monetary Fund to PNG’s economic history.
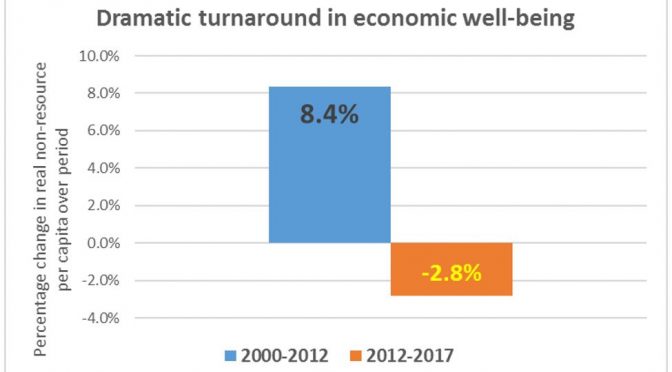
From 2012 to 2017, under the O’Neill government, average economic well-being for the people of PNG has declined by 2.8%.
This reverses positive economic gains of 8.4% from 2000 to 2012.
PNG is returning to the poor economic performance it experienced during the 1980s and especially the 1990s – lost decades for development. This is a shame.
From 1980 to 2017, economic well-being in PNG per citizen declined by an extraordinary 40.4%.
This is a development failure.
In contrast, the resource sector has grown strongly. It is now 48.1% larger per capita than in 1980. The resource sector boomed by 62% during the 1990s when the non-resource sector went backwards by 30.8%. From 2012 to 2017, once again the resource sector has boomed by 58.1% while the non-resource sector has gone backwards by 2.8%.
PNG has a development model that looks after the resource sector, but not its people.
PNG’s greatest policy mistake since Independence has been too much focus on natural resources (such as LNG or gold) rather than its extraordinary people resources. Even then, the resource sector (mining and petroleum) has, on average, only accounted for 16.1% of the economy.
Focusing on mining and petroleum resources has tended to create a dualistic economy with development benefits captured only by a few. It has led to the Bougainville civil war. The new figures from the NSO reinforce this lesson with a harshness that is surprising.
Given the poor linkages between the resource sector and broader measures of economic well-being, a new development paradigm is needed for PNG. Focusing development efforts around people, such as support for smallholder agriculture or encouraging the informal sector, will lead to more widespread and inclusive benefits.
The O’Neill government, with its reliance on the resource sector, doing deals with rich mates, and its record of economic mismanagement, will not get PNG’s development back on track. PNG deserves better leaders from its forthcoming election.
Details
Details on the methodology are in Appendix 1. Detailed results are shown below.
The author apologises for the amount of technical material. However, the analysis has some rather important conclusions and it is appropriate for a reader to have the approach and its implications fully explained. This is especially the case as this analysis is likely to be attacked by the government.
The focus of the analysis is on the economic well-being of the people of Papua New Guinea. This is analyzed through examining movements in real non-resource GDP per capita. The approach is based on French President Sarkozy’s 2008 Commission into finding a better measure of improving well-being rather than just GDP. The analysis uses the latest PNG National Statistics Office National Accounts figures from 2007 to 2014. This major update to GDP information has important implications, including re-analysing PNG’s economic history. It also uses IMF, ADB and World Bank information.
There has been a dramatic backward turnaround in economic performance since the election of the O’Neill government. After average economic well-being increased by 8.4% from 2000 to 2012, since the new Parliament of 2012 it has gone backwards. Over the last five years, the economic well-being of Papua New Guineans has fallen by an estimated 2.8%. The actual fall is probably even greater given more recent analysis of the economy’s poor performance over 2016 – such as the extraordinary fall in nominal personal and GST tax collections shown by the PNG Treasury’s Mach 2017 Final Budget Outcome.
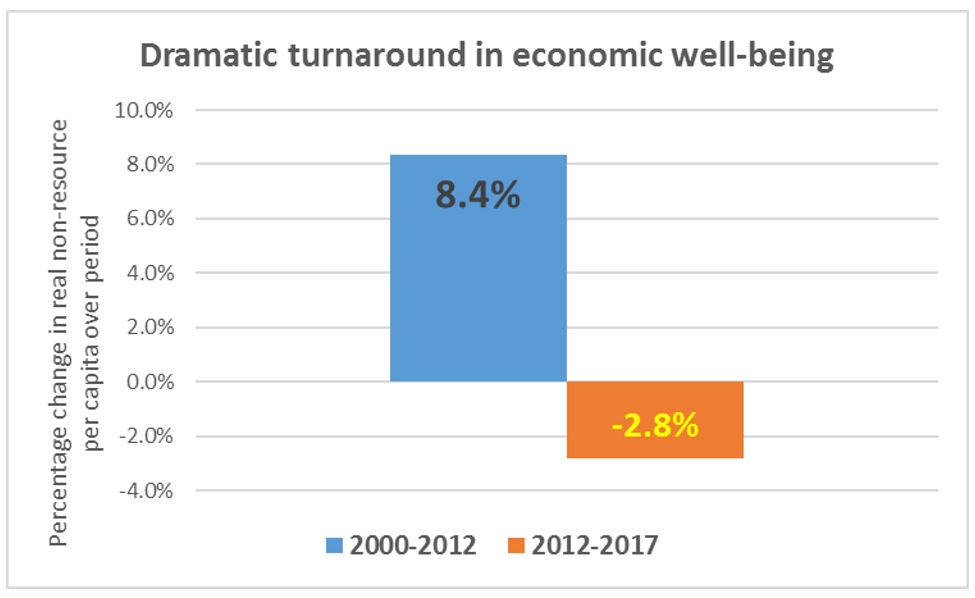
Reflecting a worrying pattern in PNG’s history, the resource sector performed in the opposite direction to general economic well-being. After declining by 35.3% in the 2000s, it has increased by 58.1% since 2012.
The following table, based on the updated NSO numbers and the latest IMF estimates, provides a broad summary of economic performance since 1980.
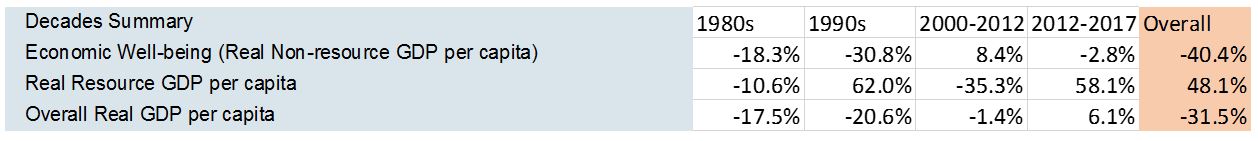
The overall decline in PNG’s economic well-being from 1980 to 2017 is 40.4%. This is a shocking development performance. It is well below what the people of PNG deserve. It is in the opposite direction to what other Asian countries have achieved.
PNG has enormous economic potential. However, poor economic policies, growing corruption, poor leadership and weakening institutions have undermined this potential.
The 1990s were a particularly abysmal period – with a decline of 30.8% from 1990 to 1999. This reflected the economic mismanagement of the mid-1990s that led to the eventual policy correction of floating the Kina to market rates, and the economic collapse under Prime Minister Skate in the late 1990s.
PNG’s economic turnaround commenced with a series of economic policies put in place by the new Prime Minister Morauta in 1999. This included policy independence for the central bank with a focus on monetary policy rather than supporting budget deficits. It also dealt with the poor management of PNG’s banks and superannuation schemes. Work was commenced on commercializing or privatizing state owned enterprises (such as the creation of BSP). The budget was reshaped to help re-establish fiscal credibility and repayment of government debt. And these changes were done in co-operation with international partners to get support to help repair the economy.
Those gains have been reversed under Prime Minister O’Neill.
In contrast, PNG’s resource sector has done very well. It is now 48% larger in real per capita terms than in 1980. PNG is a country with enormous resource riches, and these should be tapped to provide the government revenues to fund services such as health and education. However, the resource sector in PNG is one of the most lightly taxed of any country. Indeed, with the concessions given to the PNG LNG project and Ramu Nickel, for example, the tax take is less than five per cent. Ordinary wage earners can validly ask why they are paying so much more.
Focusing on the resource sector has distracted PNG from more inclusive forms of development that could have created more jobs, investment and improvements in economic welfare. For example, there has been a lack of attention through the decades to supporting the agriculture sector, including integrating it with the emerging possibilities of the Asian century. Much of this is a result of the “Dutch Disease” effect which afflicts many resource rich countries.
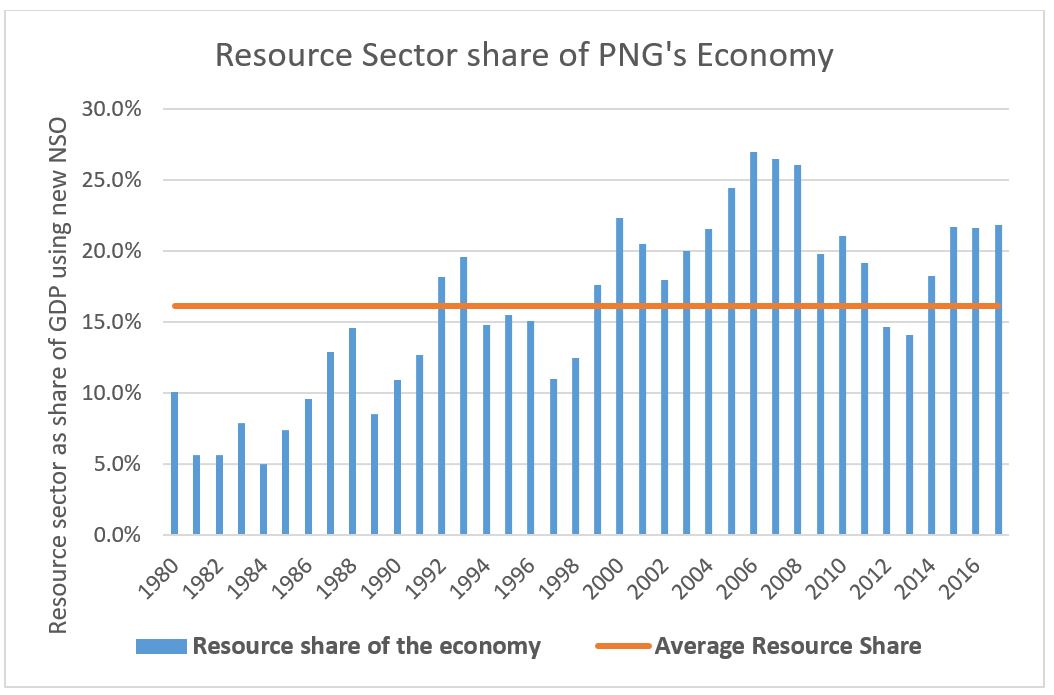
However, PNG’s resource riches need to be kept in perspective. The new NSO data has decreased the size of the resource sector relative to other sectors of the economy. For example, in 2014, as a share of the economy, the resource sector has decreased from 26.6% of the economy to 21.6% according to the new NSO information. The graph below shows the share of the resource sector in the overall economy from 1980. There is a general pattern of increase. Particular dips can be observed – such as the closure of the Bougainville copper mine in 1989 due to the escalating civil war, and the declining performance of Ok Tedi since the start of its effective nationalisation in 2012. However, the key point in the graph is that the resource sector has averaged only 16.1% of the economy. That means that over four-fifths of the national economy is based on other sectors. Only a small share of the economy is based on resources yet it is the focus of an enormous amount of government attention and influence. This is a case of the tail wagging the dog. And an inclusive, people-focused development approach is the loser.
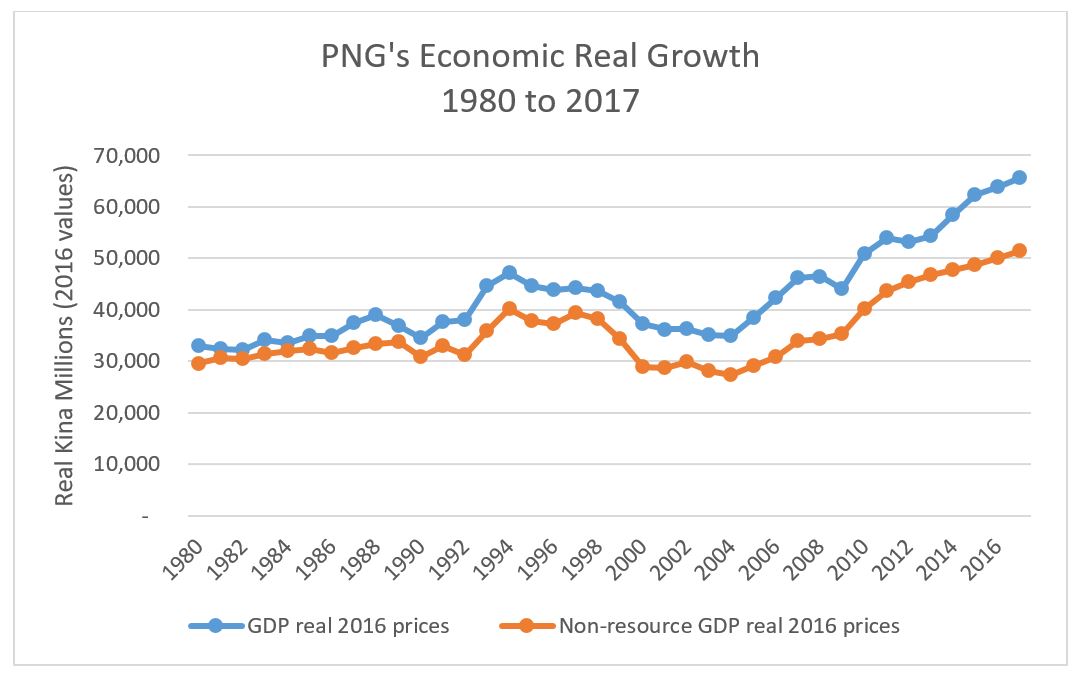
The following graphs provide a broad overview of the implications of the updated NSO GDP figures and the most recent analysis from an independent umpire (the IMF). They show changes in GDP and non-resource GDP from 1980 to 2017.
In nominal terms, so before allowing for inflation, the PNG economy is now some 23 times larger than in 1980. It has increased from K3 billion to K68.7 billion (the latter estimate is from the IMF).
However, items such as bread and rice are now much more expensive in PNG. On average, it now takes about 11 kina to buy what 1 kina could buy in 1980. Overall inflation has been 1,084%. When account is taken of inflation, then the “real” size of the economy has nearly doubled (99.7%), while economic well-being has increased by around three-quarters (73.7%). The resource sector has grown by 331.7% in real terms. These changes are shown in the following graph.
However, PNG’s population has increased from 3 million in 1980 to an estimated 8.75 million in 2017 (based on a 3.1% population growth rate since the 2011 NSO census estimate of 7.28 million). This means that the population has increased by 190% (so 2.9 people for everyone in 1980). The population growth rate is much greater than the increase in the real size of the economy or economic well-being (99.7%). Taken together, economic well-being per person is estimated as having fallen from K9,866 in 1980 down to K5,877 (all in constant 2016 prices) – shown by the orange line in the graph below.
This is a decline of 40.4%.
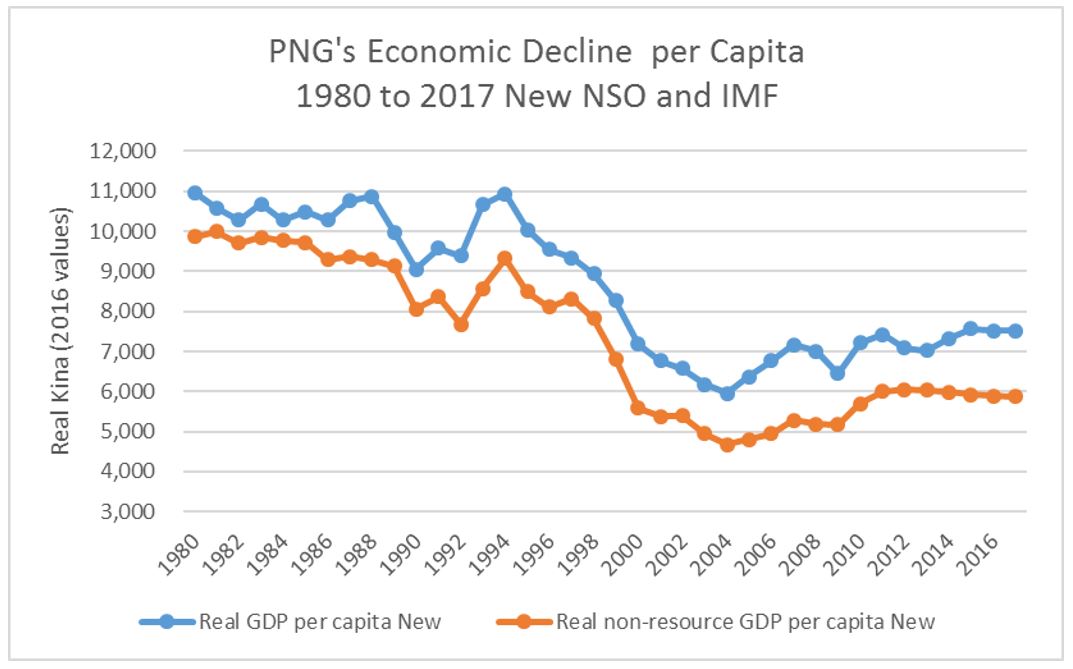
It is this shocking figure, and a return to a path of declining well-being after the gains at the start of the twenty-first century, that requires a new approach towards a more inclusive development path.
The last five years of the O’Neill government has revealed a pattern of bias toward the resource sector, doing deals with mates on over-priced contracts, and economic mismanagement. This has included undermining the independence of the Bank of PNG on both financing deficits as well as creating massive shortfalls in foreign exchange, declining transparency in government operations, misleading information on the economy and policy approaches (such as massive real cuts in health and infrastructure spending) and pro-Port Moresby decision-making. O’Neill’s suggested policy changes in areas such as small and medium-sized business development, land policy, and agriculture will reverse the growth possibilities of engaging with the Asian century.
Conclusion
PNG is missing the development bus because of the economic mismanagement of the O’Neill government. PNG’s people, apart from the rich and well-connected, will be the continuing losers unless there is a change of leadership at the forthcoming election. May PNG have better policies, better institutions and a more inclusive form of development over the next four decades to better meet the deserved aspirations of its people.
Post-script
I expect the above analysis will be attacked by the government, not on the basis of its accuracy or content, but because it comes from an “outsider”, in particular an Australian. My view is that we are all global citizens, and just as we can express views on what is happening in the US with President Trump, all global citizens can express views on what is happening in their own country and elsewhere. This is especially the case for me and PNG. This is because I love PNG and its people and have done so since my first visit there in 1978 (in areas around O’Neill’s electorate). I am also very aware of the growing difficulties for people speaking up in PNG. This analysis is shared as a friend of PNG, one who believes in its enormous potential, but one that has become very disappointed with the approaches of its current leader. Of course, it is up to the citizens of PNG to make their choices about their leaders. I hope these democratic rights will be allowed in a free and fair election, adequately informed with good and accurate information.
Appendix 1
Methodology
The National Statistics Office, with the support of the Australian Bureau of Statistics, has finally started producing updated figures on the PNG economy beyond 2006. The following analysis uses this new information from the National Statistics Office. Specifically, it uses the latest estimates on the structure of GDP from 2007 to 2014 (this incorporates some updates from the series produced in 2016). The information is also supplemented by information from the International Monetary Fund, especially for more recent estimates of growth rates (based on the 2016 IMF Article IV which still has not received adequate coverage in the PNG press). This is because the NSO does not have data for the most recent years, and the government’s estimates for the latest years are unrealistic – see here.
In broad terms, the methodology seeks to understand movements in the economic welfare of PNG’s citizens. This focus on people’s welfare drives three important decisions. First, the focus is on economic gains per person (or per capita). PNG’s economic pie must be spread out more because PNG’s population has grown rapidly. There are now 2.9 Papua New Guineans for every person back in 1980. The population figures used are from the NSO and Asian Development Bank. Second, the focus is on the spending power of people through time. This has meant the price index used is based on the Consumer Price Index rather than the GDP deflator. The latter fails to take into account important issues such as the impact of imported inflation on livelihoods. The third element of focusing on economic welfare is to separate analysis of the resource sector from the non-resource sectors of the economy. The non-resource sector covers the areas that matter for PNG’s welfare – agriculture, services, construction, trade and public administration.
The basic methodology is to use available information. The NSO now provides updated figures from 2007 to 2014. These are much higher than earlier estimates. The challenge is how to combine this new information with the historic GDP numbers provided before 2006. One option is to simply keep the sectoral shares in 2007 the same for all previous years. However, this would lose important sectoral information on changes through time included in the historic data. To keep the historic sectoral data, this information was combined with the new NSO information through applying growth indexes. Essentially, the growth indexes back cast the revised structure of the economy from the NSO’s latest 2007 figures.
Specifically, information was obtained (from NSO sources, PNG Treasury budget documents and the ADB) on the nominal size of nine key areas of the economy for every year from 1980 to 2007: agriculture; mining and petroleum; manufacturing; electricity, gas and water; construction; wholesale and retail trade; transport and communications; finance and real estate; and public administration. This information was used to determine the growth rates in each of those years to create an index for each sector from 1980 to 2007. These nominal growth indexes were then applied to the NSO estimates for 2007 (combining the new sectors into the old sector information consistent with NSO guidance). The nominal NSO figures were then added for 2007 to 2013. The results were converted to real values using the Consumer Price Index (CPI), and to per capita terms using the population figures primarily from the NSO and ADB. Projections on real growth rates in the resource and non-resource sectors are based on the 2016 IMF Article IV estimates from 2014 (this is because of concerns about the government overstating recent growth rates, contrary to the views of the IMF, World Bank – see here – and other external assessments of leading economic indicators such as falling nominal tax collections – see here).
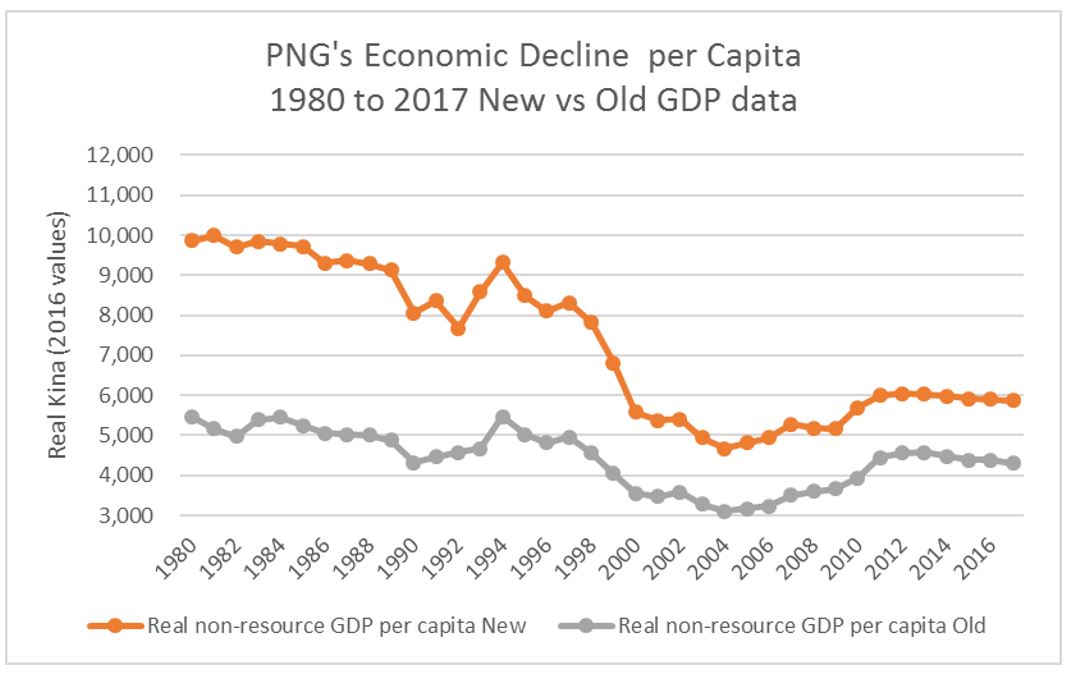
Using the new National Statistics Office estimates had surprisingly negative implication for assessing PNG’s long-term growth performance. The new growth figures are significantly lower than earlier estimates based on the old NSO numbers to 2007 and Treasury numbers after 2007 (all obtained from Budget documents). This is for two reasons. First, although the new NSO numbers lifted the estimated size of the economy by nearly 50% in 2006, the growth rates for 2007 to 2013 were significantly lower than the estimates previously provided by PNG Treasury. Second, the NSO revisions substantially increased the sizes of some areas of the economy which were relatively slow growers (such as finance and public administration) and reduced some others (such as construction, manufacturing and mining and petroleum). Generally, those areas of the economy which are now given a greater weighting (such as public administration) had a lower historic growth performance. Applying the growth index means that they become proportionately larger in 1980 – to get to the same 2007 point as the faster growing sections of the economy (such as mining and petroleum) they had to start larger. Those areas given a smaller weighting (such as manufacturing and construction) had a higher historic growth performance. Together, this means the estimated size of the PNG economy in 1980 is increased by even more than the 45% increase applied to 2007 figures from the NSO update. Indeed, the increase is 74% for the estimated nominal value of GDP in 1980 (up from K1,708m to K2,975m) – and an 80% increase in non-resource GDP. In constant 2016 Kina (real) terms, this combination of a bigger economy estimated in 2007 by the NSO, and the sectoral increases in 2007 applying to mainly to the sectors with the smallest growth increases (from 1980 to 2007), now lifts the estimated size of the economy from K18,897m to K32,913m. With this much higher starting point, and the new NSO numbers from 2006 involving smaller growth increases, and using more realistic IMF growth estimates from 2014, the best updated estimates of PNG’s long-term growth performance are considerably lower than earlier estimates. This is shown in the following graph. The lower grey line shows the estimated level of well-being in PNG based on the previous national account figures. From 1980 to 2017 the decline was 21.2%. The orange line represents the new figures, based on the updated NSO estimates and back casting them in the way described above. The decline is now 40.4%.
So why are these figures on declining economic welfare much lower than some other long-term estimates such as those included in the World Development Index? There are four reasons.
First, the focus is on non-resource GDP as this is more directly related to economic well-being in PNG rather than total GDP. As noted earlier, the resource sector has done well, but this has not had many spillover effects to the rest of the economy. The approach is based on trying to get the best measure possible for changes in well-being given the limited statistical data produced in PNG. A figure based around GNI per capita would have been better, but PNG stopped producing these figures in 2006. The aim has been to find the best possible proxy for changing real household disposable income. This is the preferred approach following the famous 2008 Sarkozy-Stiglitz Commission looking at better measures than GDP.
Second, the figures are now based on the new NSO national account estimates which show significantly lower growth rates from 1980 to 2007 (see previous paragraph).
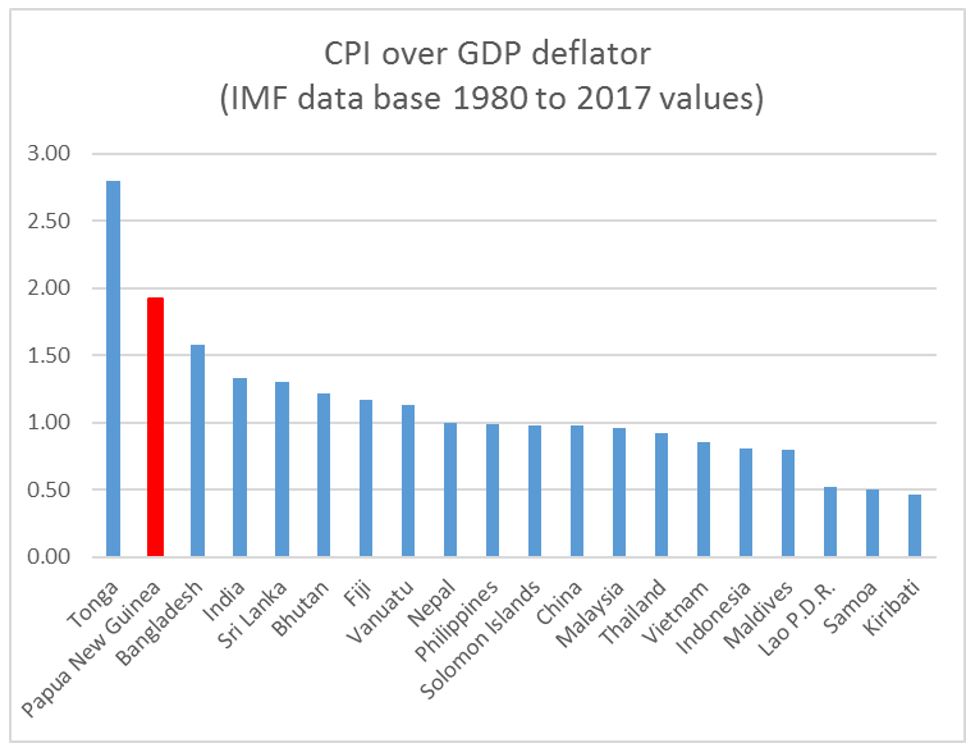
Third, the figures use a better measure of changes in economic well-being and individual spending power – so changes in consumer prices rather than changes in the GDP deflator. The latter does not include the impact of imported inflation in PNG. The latter also is greatly affected by movements in resource prices (such as gold and LNG) which have very little direct impact on people’s livelihoods. Especially as the focus of this analysis is on the non-resource sector of the economy, the impact of changing resource prices are not directly relevant (there are some indirect effects through resource taxation being spent on education etc.) Most non-resource sectors prices move closely in line with CPI prices anyway. For example, in the latest NSO constant price series on GDP for 2007 to 2014, the average annual price movement outside of mining and petroleum is 6.27%, almost identical to the CPI figure of 6.32%. This choice of price index is a particularly important difference for PNG as the divergence between these two measures is the second greatest in the Asia-Pacific region (see graph below). For most countries, the measures are almost the same such as China, Malaysia, Thailand, Philippines, Solomon Islands and Nepal. However, for PNG, the consumer price index has gone up at nearly double the rate of the GDP deflator. For some countries (such as Laos, Samoa and Kiribati), consumer prices are considered to have gone up by less than the GDP deflator – and this would under-estimate their people’s changes in economic well-being.
The fourth reason is that the figures use population estimates based around the PNG 2011 census and NSO estimates of a population growth rate of 3.1%. The NSO estimate for PNG’s population (and that in the ADB’s Basic Indicators 2017 publication) is around one million people higher in 2017 than that used by the World Bank (which uses a 2.1% population growth rate). The difference between 8.75 million people and 7.78 million is 12 per cent and this has a significant impact on calculation of well-being in per capita terms. It is very difficult to explain such a large difference in such a key indicator. The analysis uses the NSO and ADB information. The general preference is to use PNG official information unless there are serious questions about its accuracy (such as the government’s latest growth estimates which is why IMF figures are used).
Further information on the methodology can be obtained through writing to admin@pngeconomics.org.