Papua New Guinea’s overall economic growth performance since it emerged from the economic crises of the 1990s has been good – averaging over 3% per capita over the last 13 years. Over the last two years, there has been a divergence in growth measures. Official GDP per capita growth is about 20%, well above the rate for countries in the region. An alternative but better measure of economic performance for the people of PNG has fallen by 3%, 10 percentage points lower than the average for countries in the region. How is this so?
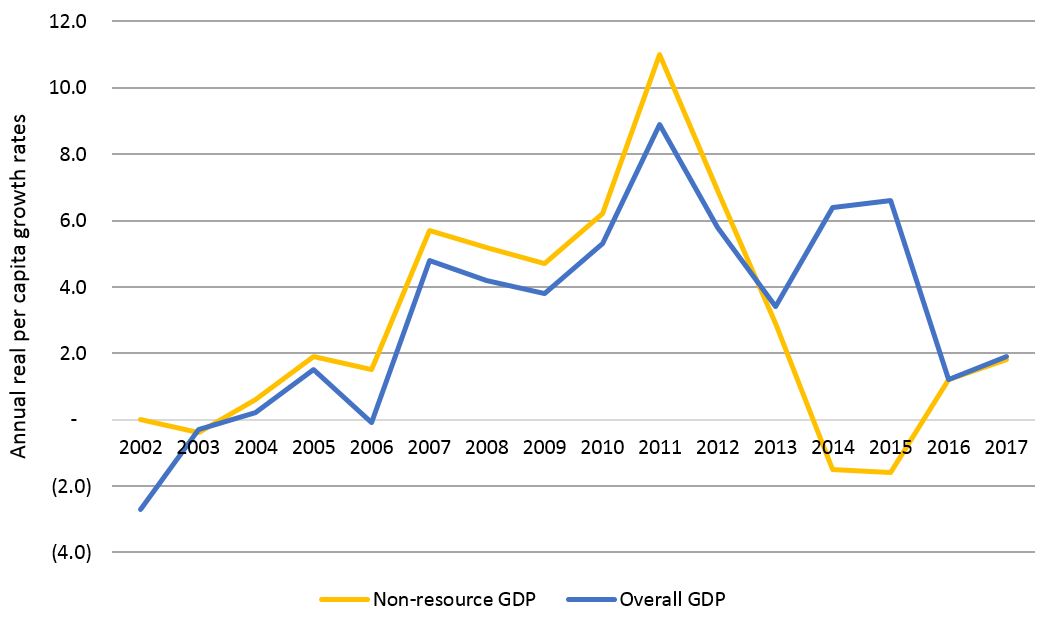
PNG budget documents have long produced two measures of economic performance: one focusing on real growth in the overall economy (Gross Domestic Product – GDP), the second focusing on how the non-resource economy is performing. These figures can be put into per capita terms (so taking account of population growth, which in PNG is currently averaging about 2.1% per annum) to get a better estimate for how the economy is growing per person in PNG. As shown in Figure 1, both measures produced similar figures from 2002 through to 2013. Over the 13 ‘growth’ years from 2003 to 2015, real GDP per capita has increased on average by 3.9% and real non-resource GDP per capita has increased on average by 3.3%. Both measures are expected to be similar from 2016 onwards.
There is a large divergence, however, between the non-resource GDP per capita growth measure and the overall GDP per capita growth measure over 2014 and 2015. Over the two years, the latest official GDP forecasts are for 25% growth (13.3% in 2014 and 11.0% in 2015), or just over 20% after allowing for population growth. Using the most recent World Bank figures [pdf] (8.5% in 2014 and 8.7% in 2015), the per capita rate over the two years is 13%; the Bank seems to make greater and more realistic allowance for the impacts of the drought (including mine closures) and a general economic slowdown. For non-resource GDP, the official forecasts of 1.2% and 3.3% are for only 0.3% growth over the two years, after allowing for population growth. Using the recent World Bank non-resource GDP figures of 0.6% in 2014 and 0.5% in 2015, the per capita rate over the last two years is minus 3.1%.
This large divergence in 2014 and 2015 between GDP and non-resource GDP is largely the result of the commencement of the PNG LNG project. This project involved two distinct stages – the investment stage (2009 to 2013), which primarily benefited non-resource GDP, and the production phase (from 2014 onwards), which primarily benefits resource GDP (and therefore overall GDP).
Figure 1: Non-resource GDP and GDP annual per capita growth rates 2002 – 2017
Notes: Based on Government figures to 2012 and World Bank figures, estimates and projections from 2013 to 2017. All data for this and other figures available in this spreadsheet [xlsx].
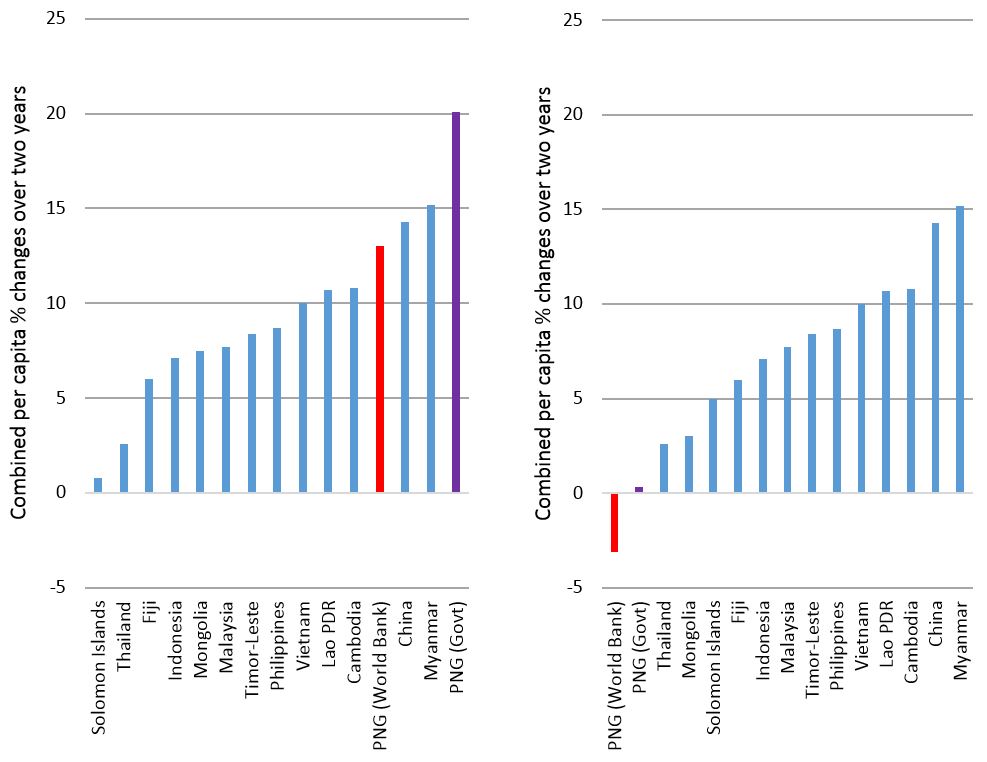
Clearly PNG’s recent growth performance looks very different depending on the measure used. Figure 2 shows real growth per capita of Gross Domestic Product (GDP) across the 14 countries covered in the latest World Bank East Asia Pacific Economic Update, October 2015 (using World Bank data for PNG as well as the other countries). When using real GDP per capita measures, PNG performs exceptionally well. However, when using non-resource GDP growth per capita, PNG becomes the worst performing country in the region (Figure 3). Indeed, its most recent performance is 10 percentage points lower than the average for countries in the region.
Figures 2 and 3: Changes in GDP per capita (lhs) and non-resource GDP per capita (rhs)
Note: Non-resource GDP is available for PNG, Mongolia (IMF figures), Solomon Islands (IMF figures) and Timor- Leste (indeed, Timor-Leste only publishes non-oil GDP figures). For other countries, with smaller resource sectors, it is assumed that non-resource GDP is well-approximated by GDP. This was tested by using an alternative measure of private consumption for eight of the countries, which produces a very similar graph to Figure 3. Details in spreadsheet [xlsx].
Which of these two measures is a better guide for assessing recent changes in economic well-being in PNG? Focusing on non-resource GDP growth per capita is a better measure for two reasons.
First, most of the benefits from the start of LNG production do not flow to the people of PNG. Instead, they go to repay the loans that funded 70% of the project, as well as the overseas project partners, mainly through dividend flows. Technically, net factor incomes abroad should be subtracted from the real GDP growth measure to get a better idea of how the economy is benefitting the people of PNG. This measure is called Gross National Product. Unfortunately, PNG stopped producing it in 2006.
The second major reason GDP growth is a poor measure of changes to economic welfare is that real GDP growth ignores all price effects. As acknowledged [pdf] by BPNG Governor Bakani, it is only designed to measure changes in production volumes. GDP excludes the direct impacts of the dramatic fall in commodity prices between 2014 and 2015 (indeed, Table 2 of the latest BPNG Monetary Policy Statement [pdf] indicates LNG prices will fall by over 50% between 2014 and 2015). No business would simply focus on its increased production without mentioning to its shareholders that the prices of its production have dramatically fallen. Of course, real non-resource GDP growth also ignores price effects in the non-resource sector, but they have been much smaller.
Using real non-resource GDP per capita growth also encourages policy-makers to focus on sustainably lifting the performance of those parts of the PNG economy that matter most for its population. The agriculture sector, which is vital for the livelihoods of 80% of PNG’s population, has grown on average by only 1.1% per annum from 2002 to 2015. This is only one-third the average rate of the non-resource sectors. Looking forward to 2016 and 2017, both the PNG Treasury and World Bank estimate on-going performance for the economy as a whole at only around 1.3% to 1.5% per capita per annum. This is well below expectations for many other Asian countries.
PNG’s economic growth performance over the last 13 years has been good. The PNG LNG project has been and will be good for the people of PNG, but its importance has been overstated by measures such as real GDP growth rates. Looking at a better measure of change in well-being for its people – per capita non-resource growth – PNG has done well from 2004 to 2013, but is estimated to have gone backwards over the last two years. PNG should focus on policy changes benefitting the non-resource sector – especially the poorly performing agriculture sector, where the majority of the people of PNG earn their income.
Paul Flanagan is a Visiting Fellow at the Development Policy Centre.


