
- PNG needs more credible policies to rebuild confidence and assist recovery from a significant economic recession in 2014 and 2015
- PNG’s history from the 1990s indicates this has usually involved reaching out to others for assistance and considering closely its leadership.
- The real growth rate from the latest NSO and BPNG figures over 2014 and 2015 is now minus 1.3% – down from earlier estimates of plus 3.6%.
- BPNG figures on leading economic indicators suggest that real growth was probably considerably lower than this official forecast – some 3 to 5% negative real growth.
- Updated BPNG figures indicate the PNG economy (outside of LNG which affects very few people in PNG) has had:
- A major fall in employment (by 7% over two years, especially in the Highlands, Southern and Morobe regions);
- Declining business sales (an extraordinary drop of 16% from September 2014 to September 2015 – the latest available data); and
- Declining lending to the private sector which is undermining investment.
- In a historic perspective, the 2012 to 2015 period averaged (at most) real growth in non-resource GDP of 1.7%. This compares to 7.7% in the period 2007 to 2011, 2.6% for 2002 to 2006, -2.3% from 1997 to 2001 (PNG’s last major economic crisis) and 3.4% from 1992 to 1996.
- These updated figures help explain why tax revenues are lower than expected – leading to government cash shortages. The driver for lower revenues is the economy being in recession – not lower LNG revenues. These updated figures also reflect how foreign exchange shortages are slowing growth.
Key conclusions
This new data is of great concern. While turning on the PNG LNG taps has made the headline GDP numbers look good (24% growth over two years), this has been a smokescreen for how poorly the key parts of PNG’s economy have been doing over 2014 and 2015. The combination of economic statistics indicates PNG has just had a significant recession for the parts of the economy that most affect PNG’s citizens.
Looking forward, the economy still suffers from foreign exchange shortages driven by poor policy choices, faces downward pressure on aggregate demand due to the major reduction in government expenditure (related to excessive earlier promises and poor revenue effort) and continuing uncertainty on commodity prices. Announced policies in areas such as agriculture, lands and SME have hurt confidence and will discourage growth. Earlier warnings about a slippery slope were ignored and there is now much more repair work to be done. The causes for the recession include the El Nino drought and falls in commodity prices, but the causes also go well beyond these specific issues and to the heart of poor economic management in PNG over recent years. However, with the right leadership and policies, PNG should be able to realise the opportunities owed to its people by embracing the Asian century.
Apology
This blog is longer than desirable. However, as the conclusions above are likely to be controversial (I would expect some further condemnation from critics), it is considered important to provide considerable details on the methodology, sources and arguments. For those wanting even more detail, I can provide the background Excel spreadsheets for those writing to admin@pngeconomics.org.
Perceptions and Measurement
PNG has suffered a significant recession in its economy over the last two years. In practical terms, this is reflected in businesses talk of conditions having been “tough”. Getting a job is harder than usual – indeed job levels have gone backwards. Bank lending to the private sector is falling in real terms. People in PNG are doing it tougher than two years ago.
Economists try to measure how material well-being changes through time. As argued here (an important background read for the approach in this blog), the best measure for countries such as PNG is to look at non-resource real growth in the economy. There has been a marked divergence in growth as measured between just GDP, or non-resource GDP. Since that earlier analysis there have been two significant developments which have taken another 5 per cent off the earlier analysis. First, the National Statistics Office has revised its estimates of all sectors of GDP from 2006 to 2013. Second, BPNG has produced new numbers on the performance of the economy through 2015 (see here), as well as providing some more up-to-date NSO figures at the Cairns investment conference on 16 May (see here as well as the Governor’s powerpoint presentation) . In addition to GDP numbers, economists also use other leading economic indicators such as employment levels, sales figures, lending patterns and tax collections. These are all examined below to reach the conclusion that PNG experienced a major economic recession across 2014 and 2015. For the purposes of this note, a recession is considered to be a significant decline in economic activity extending over at least two quarters. Non-resource GDP is used as the base as other measures such as GDI are not available for PNG, and the lives of people of PNG are most affected by sectors outside of mining, petroleum and LNG. The commencement of LNG shipments (so the move from the investment stage to the export stage) is good for PNG’s measured exports and GDP, but not for employment levels or economic activity within PNG itself. The flow-on benefit from the export stage of PNG LNG should be primarily through tax and other revenues but with low prices, concessionary tax arrangements, and a lack of clarity on distributions to stakeholders, these are not occurring as yet.
Lower levels of economic activity from NSO and BPNG
Putting together the new numbers from the NSO and BPNG (details in Table 1), non-resource GDP in PNG has not kept up with inflation over 2014 and 2015. According to updated figures from these two official sources, there has been a 1.3% decline in the real size of the economy. The methodology in using these two official sources (so this recession number of negative real growth is based entirely on BPNG and NSO numbers) is as follows. In a speech by BPNG’s Governor in May, he provided an updated figure for 2015 GDP of K64.2 billion. He also provided a sectoral breakup of that GDP – including the resource sector. The BPNG sectoral percentages were applied to the BPNG GDP number – these are shown in the fifth column of Table 1. These are then compared with the NSO GDP sectoral share figures shown in column 4. A simple growth calculation shows the percentage increase in nominal terms (column 6). From this 9.9% nominal growth in non-resource GDP figure is deducted 11.2% inflation over the two years (using the latest BPNG CPI numbers – QEB Table 9.4 All Groups annual % changes of 5.2% in 2014 and 6.0% in 2015). This gives the real growth rates over the two years shown in the final column. All the figures are based on official NSO and BPNG numbers.
The negative 1.3% growth rate in non-resource GDP in Table 1 is nearly 5 percentage points down from the official Treasury 2016 budget estimates of plus 3.6% over the two years. Given PNG’s population is estimated to increase by 2.1% per year, the negative 1.3% figure means that on PNG’s average standard of living has declined by 5% over the last two years.
Table 1: Deriving 2014 and 2015 growth rates from NSO and BPNG 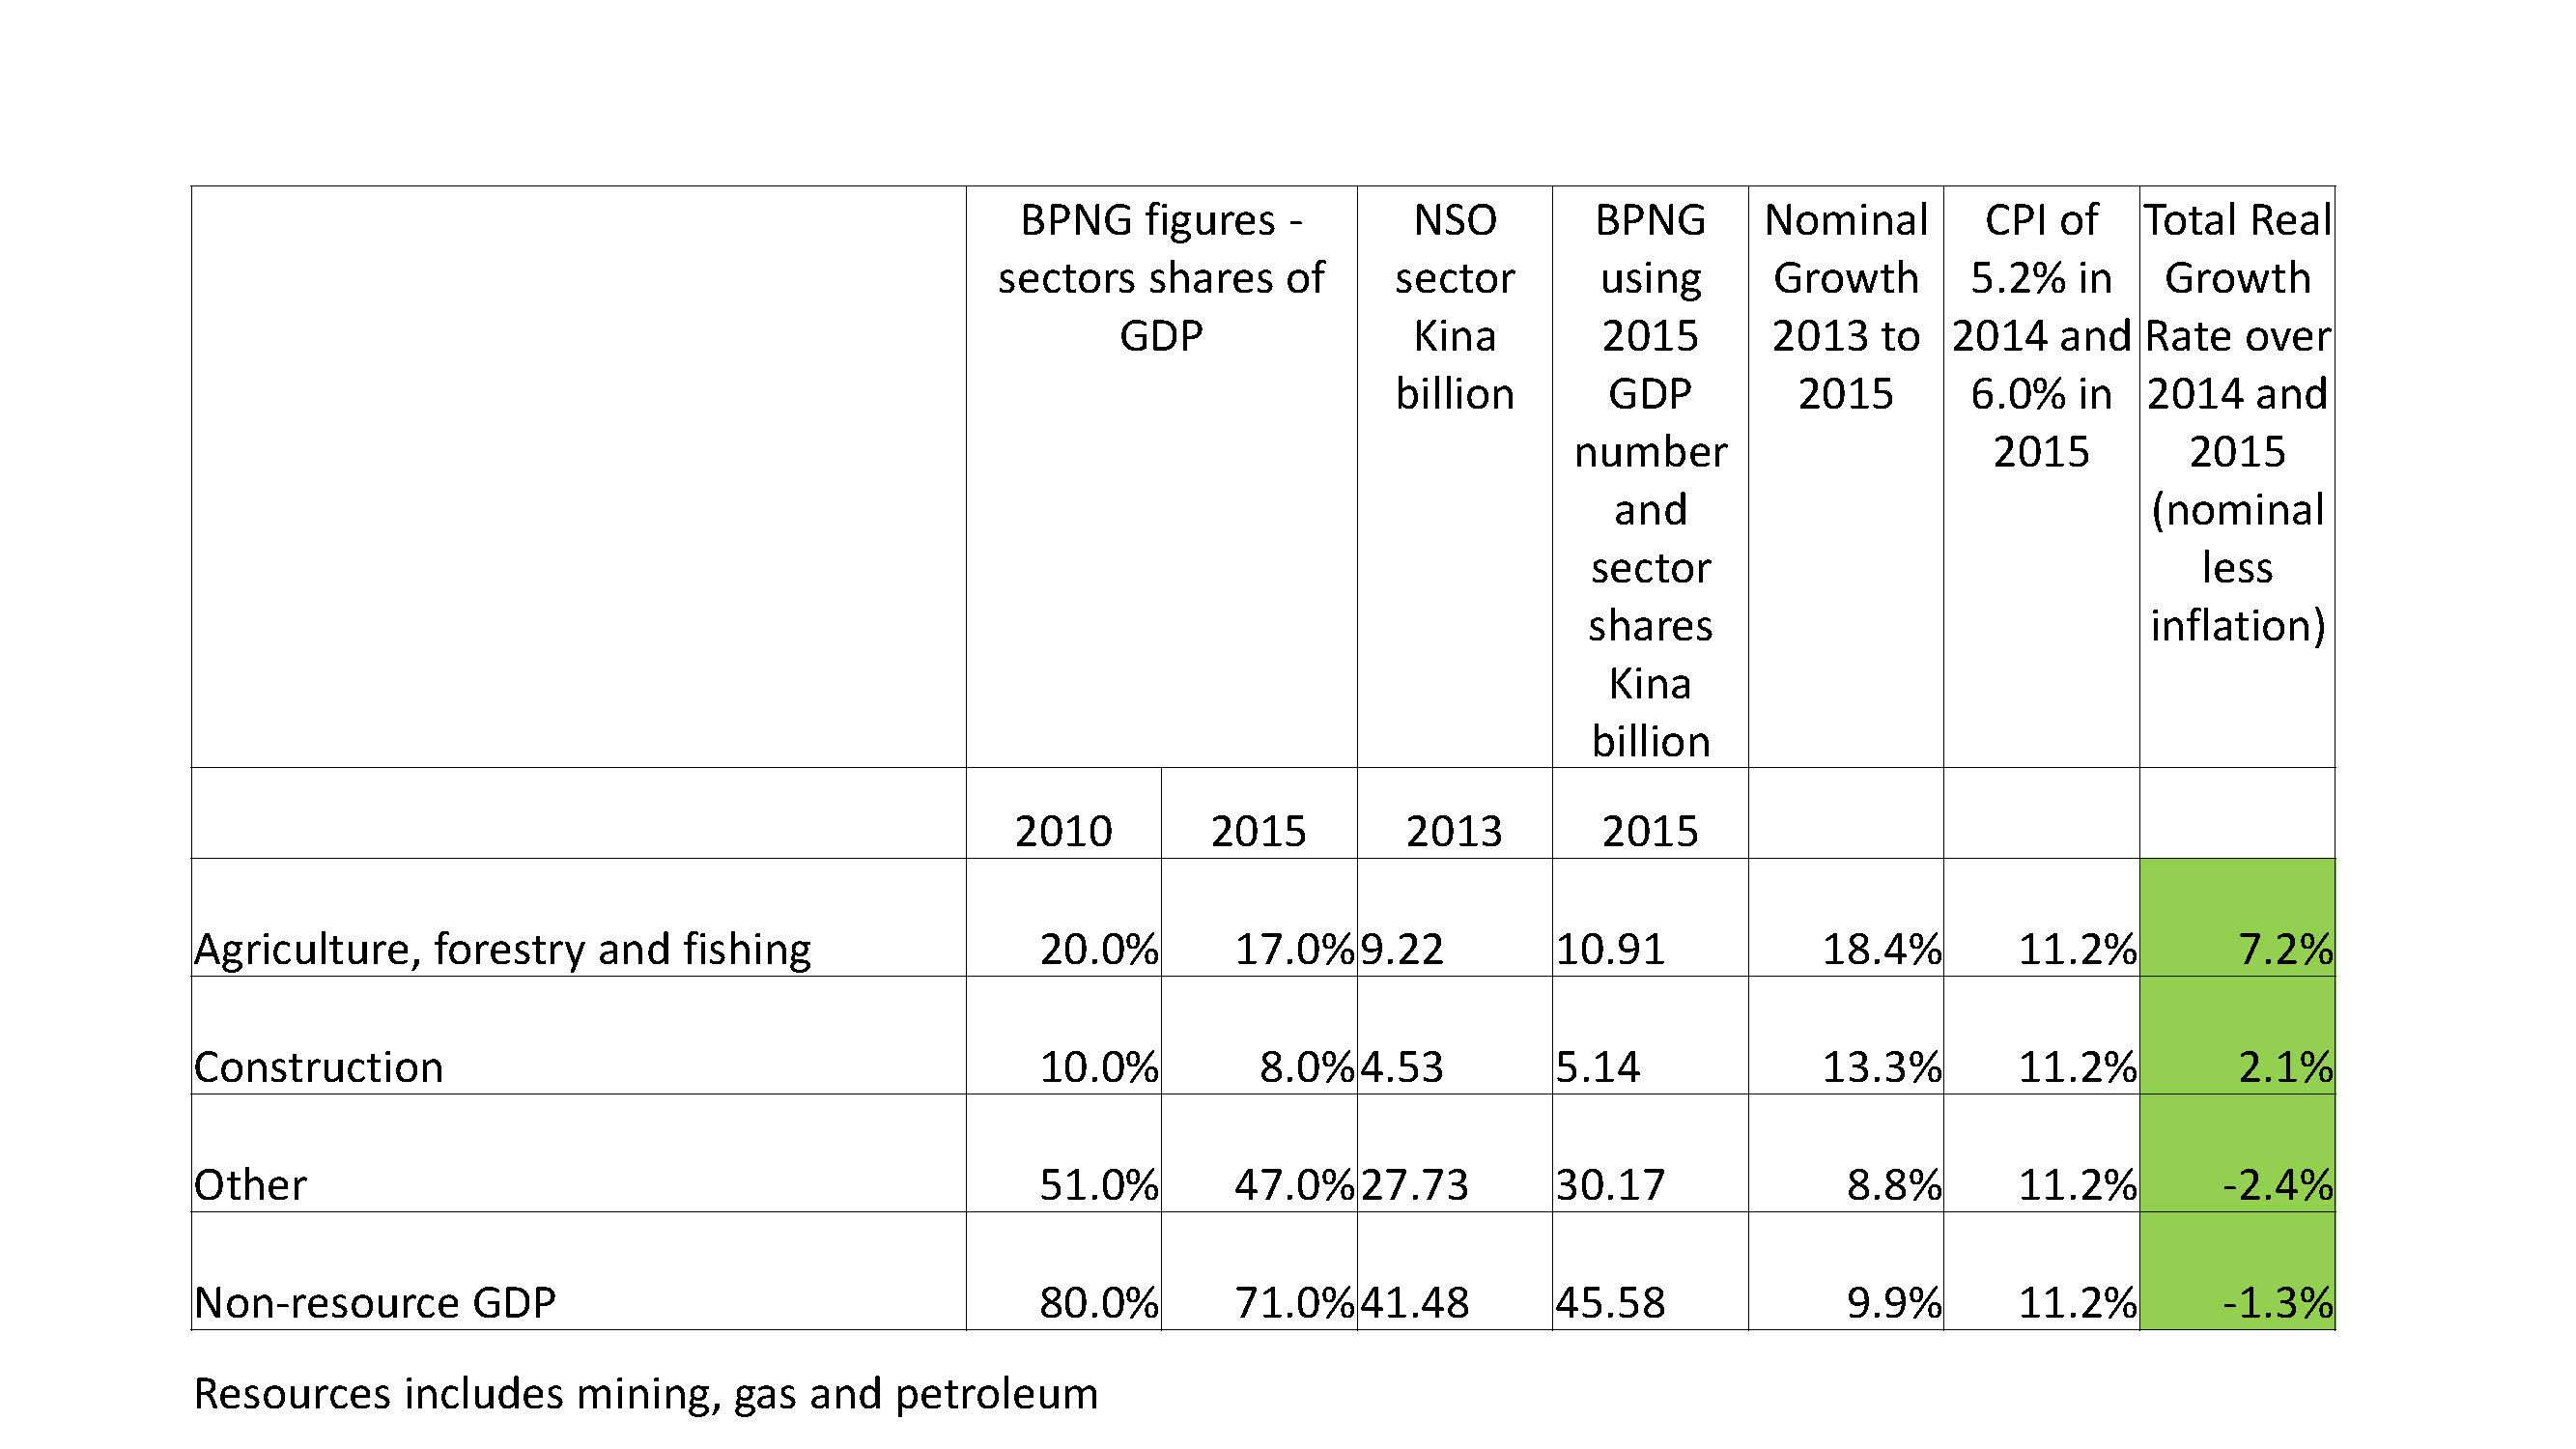 A key surprise in this table derived from official sources is the apparently very strong growth in the agriculture sector of 7.2% over 2014 and 2015. With the worst drought in two decades, this seems implausibly high. In addition, the leading indicators information below suggest a major contraction in the agriculture sector. This contraction is also reflected in major declines in the volumes of agriculture commodity exports over this period (minus 56% for tea, minus 36% for rubber, minus 20% for cocoa, minus 12% for coffee, minor drop in palm oil, a large increase in copra and copra oil but the latter account for only around 3% of the total value of agriculture exports – BPNG QEB tables 8.4 and 8.3). A more realistic estimate for the agriculture sector would be 0 per cent growth (and possibly less based on the export figures and the drought affecting the subsistence sector). This would suggest an overall fall in non-resource GDP over the two years of at least 2.5% (-1.3%+(17% weighting in 2015 times -7.2%). To be conservative, and only using official numbers, the figure of negative 1.3% is used in Graph 1 below.
As noted in earlier blogs, it is important for these new NSO numbers to be validated by a more independent body such as the IMF. My greatest concern was the 48% jump in measured GDP within 2006 – this needs further explanation. This new base will have little impact, however, on the growth story above relative to using the previous Treasury weights for sectors.
This negative outcome in non-resource GDP over 2014 and 2015 is also reflected in tax statistics. Generally, tax collections are very strongly correlated to the relevant areas of GDP. Looking at non-resource tax collections (so avoiding the direct impacts of falling commodity prices), these have not kept up with inflation over the last two years. Comparing tax outcomes shown in the 2015 Final Budget Outcome with 2013 actuals, tax revenue has fallen in real terms by 2.6% (8.6% nominal growth from K7,922m to K8,602m less 11.2% inflation). More specifically (all figures in real terms over 2014 and 2015) personal income tax collections have fallen by 3.1%, GST collections have fallen by 11.5% (an extraordinary decline although possibly affected by timing issues on refunds), excise collections have fallen by 18.3% (another extraordinary decline) and import duty collections have fallen by 16.6% (also reflecting the impact of foreign exchange controls). These declines have been partially offset by increases in company tax of 4.1% and increases in other smaller revenue heads.
Looking deeper into other leading indicators of economic activity, the indication is that the fall may be considerably larger than the official growth numbers. This is based on the following three key indicators – all sourced from the May 2016 release on economic conditions (December Quarterly Economic Bulletin) from the Bank of PNG.
Employment
Employment growth is linked to levels of economic activity. Unfortunately, employment has fallen by 7% over the last two years (a decline in the overall employment index from 175.8 to 162.9). This is going backwards – PNG should be achieving increases in employment every year given the number of underemployed and the number of students entering the workforce. The fall in employment levels is very mixed across the country. Employment has fallen sharply in the Highlands region by 23%, in the Southern region by 21%, and in Morobe by 14%. Areas such as Momase (for BPNG statistics, Momase covers Madang, Wewak and Vanimo but excludes Morobe) have had a 7% increase in employment, while the NCD has had a more mild fall of 4%.
By industry, the biggest falls in employment over 2014 and 2015 have been in the Wholesale industry (10%), Manufacturing (10%) and Agriculture (a 9% fall). The construction industry has been the only industry recording positive employment growth, and this has been at a level of only 2%. (Data from BPNG QEB Tables 9.6 and 9.7)
Business Sales
According to BPNG’s Business Liaison Survey, business sales have fallen by an extraordinary 16 per cent over the year from September 2014 to September 2015 even before allowing for inflation. This is the latest available survey (unfortunately, the ANZ has stopped publishing its previous survey of business conditions). The following numbers are based on one year changes and don’t allow for the impacts of inflation (which would reduce all figures by around another 5 percentage points).
The fall in business sales over the year was particularly sharp in Southern with a drop of 60.4% – linked to the closure of the Ok Tedi mine as well as declines in oil palm sales. Both Momose and Southern regions also had extraordinarily large falls of 28.4% and 18.5% respectively. In many countries, there are major concerns when sales drop by even a few percentage points – so these figures suggest very major declines in economic activity. Sales in the NCD increased by 1.3% and in the Islands by 5.6%.
By industry, the fall was most acute in Agriculture – with a fall of 28.2% reflecting the impact of the drought and falling commodity prices.
Other industries also faced major declines such as Wholesale by 17.8%, Manufacturing by 17.6% and Retail by 17.4%. The cause for such large declines in these industries is more likely driven by the foreign exchange restrictions as well as declining general economic activity. These impacts are also reflected in the falls in employment in these industries. On the other hand, the construction industry has had a major increase in sales (linked to developments in Port Moresby although this measure can be affected by the timing of large contracts) as well as a 13.7% increase in the Finance, real estate and business services industry.
Lending patterns
Overall, the private sector is being displaced by government and state owned enterprises in lending patterns. Lending to the private sector has fallen by an estimated 4.1% in real terms over 2014 and 2015 (a 7.1% nominal increase from K9,911m to K10,612m less inflation of 11.2%). In contrast, there have been very large expansions in lending to the government and state owned enterprises. For the government, the 82.8% real increase in lending (K2,589m) reflects financing of part of the government’s historically high deficits by the banks. The greatest surprise in BPNG’s figures is the extraordinary 1,774% real increase (K2,210m) in lending to “public non-financial corporations” – more commonly called State Owned Enterprises. Over 2014 and 2015, there was a remarkable shift towards government-led activity and away from the private sector. 87% of increased lending was to government related bodies. (Source – BPNG QEB Table 1.3).
Historic perspective
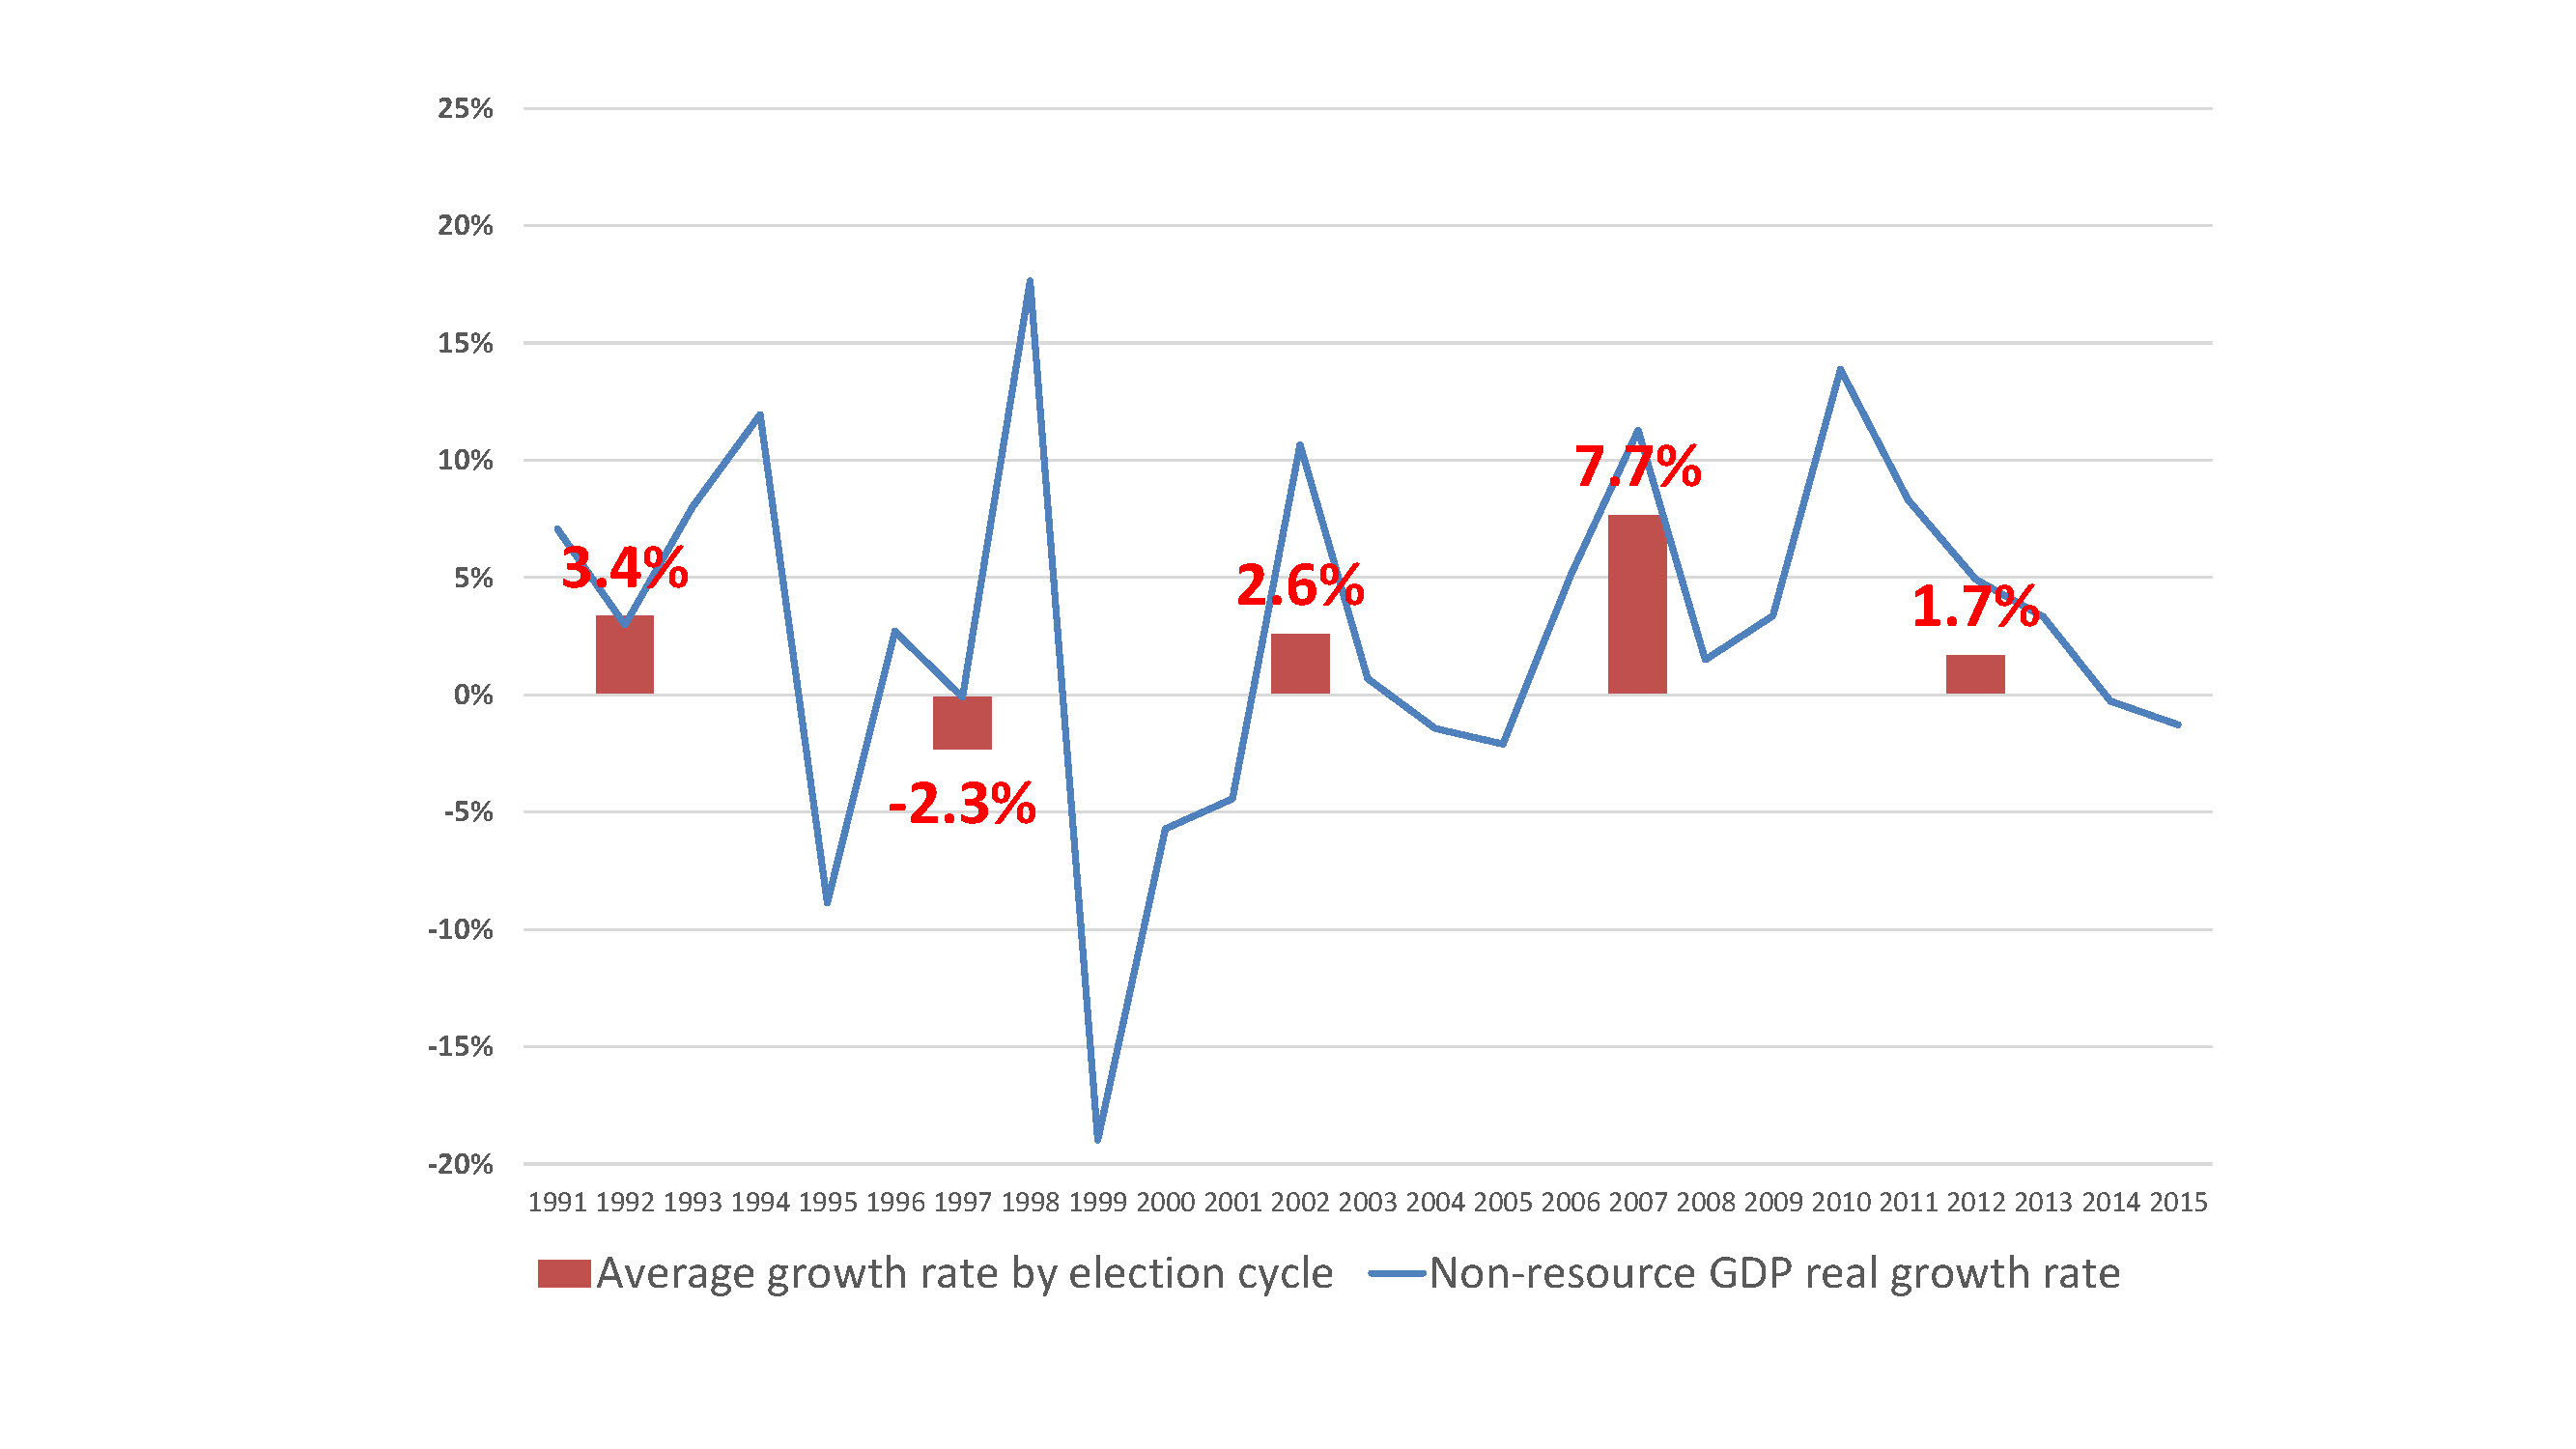
PNG’s history of growth in the critical area of non-resource GDP are shown in the graph below. The blue line indicates annual real growth rates. The red columns takes averages of the years related to five year election cycles (although figures from 2016 are not yet available).
The 2012 to 2015 period averaged (at most) real growth in non-resource GDP of 1.7%. This is below PNG’s population growth rate. It means that real income per capita has declined over this four year period. Leading economic indicators (employments, sales, lending) suggest the real figure is lower. Using the official figures, this 1.5% average rate compares to 7.7% in the period 2007 to 2011, 2.6% for 2002 to 2006, -2.3% from 1997 to 2001 (PNG’s last major economic crisis) and 3.4% from 1992 to 1996.
Graph 1: PNG Non-resource growth 1991 to 2015
Conclusions
This new data is of great concern. While turning on the PNG LNG taps has made the headline GDP numbers look good (that number looks a healthy 24%), this has been a smokescreen for how poorly the key parts of PNG’s economy have been doing over the last two years. PNG has just had a significant recession. The official figures are now down to negative 1.3% real growth in non-resource GDP – those parts of the economy that affect the vast majority of the people in PNG. However, falls in employment of 7%, of 16% in business sales, and 4% in private sector lending all suggest that the economy has gone backwards even more severely. My conservative estimate would be a fall of 3 to 5 per cent over these two years. This judgement is reinforced by the official GDP numbers including assumptions of nominal growth in the agriculture sector of 18.4% over the two years (inconsistent with the falls in employment of 9% over the two years and the 28% drop in sales noted above). Remaining non-resource sectors actually show negative official real growth rates of around 2 per cent while the employment and sales figure above suggest the figures would be even lower. Falls in real tax collections also support this conclusion that PNG has just gone through a significant recession in non-resource GDP (and probably in other measures such as GDI or GNI).
Ironically, the mathematics of growth numbers means that this lower base level will make it easier to have a positive growth number in 2016. The ending of the drought (although not yet its human impacts) and the resumption of mining will have positive growth impacts. However, the economy still suffers from foreign exchange shortages driven by poor policy choices, faces downward pressure on aggregate demand due to the major reduction in government expenditure (related to excessive earlier promises and poor revenue effort) and continuing uncertainty on commodity prices. Announced policies in areas such as agriculture, lands and SME have hurt confidence and will discourage growth. Warnings about a slippery slope were ignored and there is now much more repair work to be done. However, with the right leadership and policies, PNG should be able to grab the opportunities owed to its people of embracing the Asian century.