 This is the second of two posts on Papua New Guinea’s 2016 Budget, with the first available here.
PNG is a high-taxing and very high-spending country relative to its Asia Pacificpeers. Most of any adjustment to the fiscal balance should therefore occur on the expenditure side. PNG is planning to do this with a drop in the expenditure to GDP ratio from the highest level ever, of 38.1% in 2013, to its lowest level ever, of 24.6% in 2020. PNG has never attempted such a fiscal consolidation – not even to recover from the fiscal crises of the 1990s.
Putting this into an international perspective, PNG is seeking to adjust government expenditure by 13.5% of the economy. This is more than double the government expenditure reductions undertaken by Greece of 6.3% (from 51.4% of GDP in 2010 to 45.1% of GDP in 2015). Of course, PNG is not facing a Greek-style fiscal crisis (at the start of its crisis Greece had a broadly similar deficit of 11%, but a much higher public debt level of 170% of GDP), but it is planning a similar or more draconian response. PNG is seeking real expenditure cuts of 23%, and Greece of 16%, in the peak expenditure cutting period (for PNG, from the 2015 budget to the 2017 forward estimates, for Greece, from 2011 to 2013). In nominal price terms the cuts are similar (15% each), but Greece has a lower inflation rate. The editorial suggestion made after the budget that “the budget cutbacks on expenditure announced in the budget speech do not compare in severity with what countries like Greece would do” was very understandable at the time. In fact, however, this more detailed analysis indicates that PNG has gone down a path of tougher cuts than Greece, even though its fiscal problems are not as severe.
This comparison is made to highlight the extent of expenditure adjustment contained in the 2016 budget. The magnitude of such cuts is not realistic, credible or desirable, especially when one looks at how they have been made.
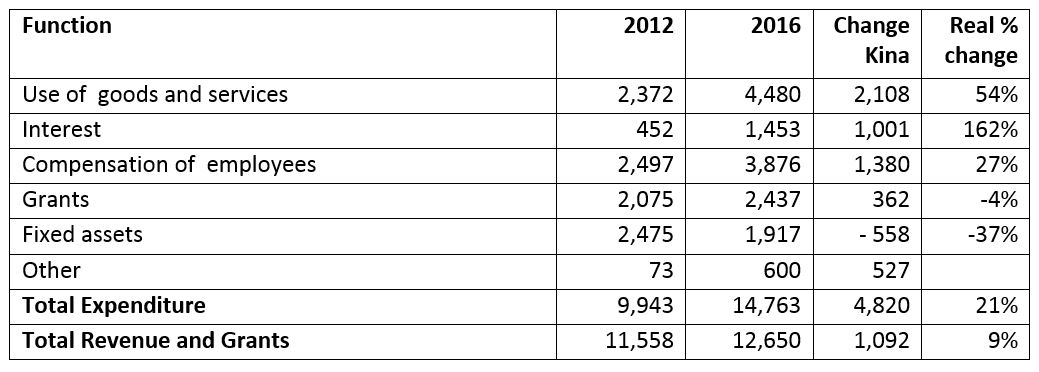
The following tables examine expenditure in greater detail (view the details in this spreadsheet). A new functional expenditure classification indicates changes in key areas of PNG expenditure from 2012 to the 2016 budget. The final column shows the real expenditure growth or decline between 2012 and 2016. Overall, the main areas of growth have been “Use of Goods and Services” (mainly resulting from the expansion of the DSIP and PSIP programs controlled by MPs – K964m – as well as cash transfers to schools through Tuition Fee Free education – K600m), interest costs (a near trebling of costs requiring an extra K1 billion each year), and compensation of employees by K1,380m (so, essentially an expansion in public service costs). In contrast, there has been a major reduction in investment in fixed assets (mainly infrastructure such as roads). After increasing from 2012 to a peak in 2014 of K4,903m, infrastructure investment has now been cut back dramatically to K1,917m in 2016. This is not a one-off adjustment: investment levels are forecast to continue falling in real terms.
Budget functional table, 2012 to 2016 (current kina, millions)
Sectoral information is more difficult to gather. The next table rebuilds the original 2015 budget according to new sectoral classifications to get a better overall understanding of the pattern of cuts since the government started responding to the fall in LNG prices, and assigns “unallocated” funding of K908m in 2017 proportionate with priorities shown in the 2016 budget.
Budget sectoral table, 2015 to 2017 (current kina, millions – percentage changes in real terms)
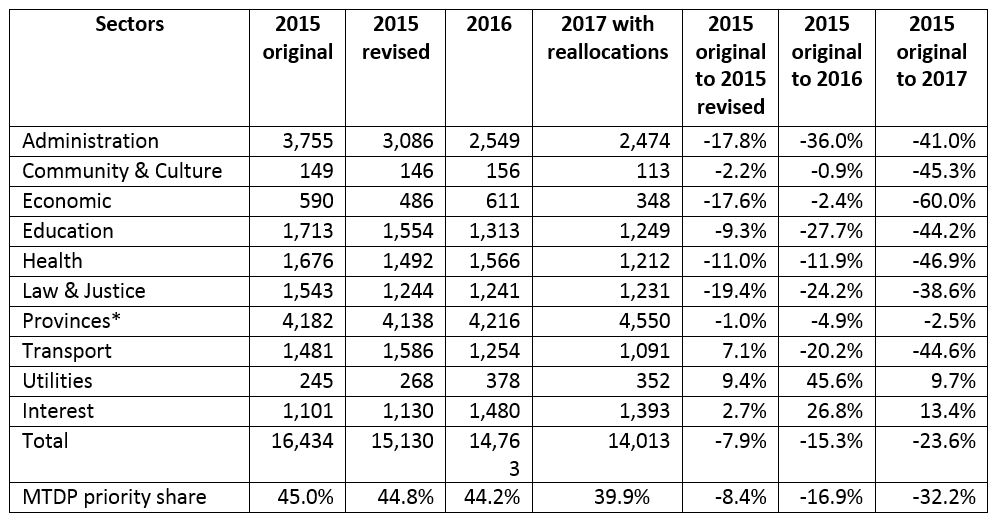
*Provinces include GST and bookmakers turnover tax to provinces.
Overall, the 2015 Supplementary Budget (which gives us the 2015 revised figures) reduced expenditure by 7.9% (this reflects a real cut as it was within the same year, so no allowance is made for inflation). The 2016 budget reduced expenditures by a further 7.4% in real terms (2.4% nominal and 5% inflation), and foreshadowed further real cuts of 8.3% in 2017. The largest reductions are for the economic sector (which includes agriculture and SMEs) where the reductions are 60% in real terms. There are cuts of around 45% in real terms for each of the education, health and transport sectors. After allowing for the protected K600m for Tuition Free Fee education school payments, the reductions to the remainder of the education sector are even more extensive, and it is hard to see how they will be achieved. Overall, the share of priority sectors in total spends falls from 45% in the 2015 budget to 40% in the 2016 budget, due to crowding out by interest payments and provincial expenditures.
One interesting feature of the 2016 budget is the cuts to the various sub-national programs of DSIP, PSIP and LLG funding. Relative to 2015, DSIP funds are cuts by one-third (the extra K5m per district announced in the 2015 budget for health and education capital programs was halved in the supplementary budget and abolished in the 2016 budget), the PSIP is more than halved (from K5m per district in each province to K10m in total for each province) and LLG funding is cut by 80% from K500,000 to K100,000 per LLG (done in the supplementary budget). However, these items still account for K1,142m in 2016 – some six times higher than the level of K178m in 2012.
In the midst of all of these cuts at the sectoral level, there are concerns when looking at even greater detail. This is most clearly illustrated by noting that the government is still committed to hosting the APEC meeting in PNG in 2018 at a cost of K3 billion (figure contained in IMF Article IV report). This is more than the $US1 billion in extra debt planned through the sovereign bond. It contrasts to insufficient funding for preparations for the 2017 election (only K10m relative to the out-going Electoral Commissioner’s planned K170m, with another K600m hoped for in 2017), road maintenance, drought relief and the halving of support for the well-respected church health partnerships.
Overall, the legacy of the 21% real expenditure increases between 2012 and 2015 is large increases in interest costs, large increases in public service payments, and significant payment to electorate funds and schools. Infrastructure has been cut, and will continue to be cut. Going forward, there are very large cuts planned in areas such as health, education, infrastructure and support for the economic sectors. There have been cuts to politically sensitive areas such as DSIP and PSIP relative to 2015, but still a huge increase relative to 2012. The budget also protects other big ticket items such as APEC, while at the same time cuts programs that could have much greater benefit for the people of PNG.
Deficit financing
Although the dramatic expenditure cuts outlined above are quickly reducing the size of PNG’s deficit, this still amounts to K2,112m in 2016 or 4.4% of GDP. The large deficits of recent years mean limits have been reached on how much can be raised from domestic financiers (such as the private banks and superannuation funds). The government is planning a $US1 billion sovereign bond (around K2,800m) to meet the deficit and also to restructure its debt portfolio. If this bond is not successful, it is not clear how the deficit will be funded. The credibility of the government’s documents, including this budget, will therefore be important in determining whether adequate financing can be secured from international financiers.
Overall assessment
This budget was always going to be challenging. The 2015 budget reflected hopes that the largest deficits in PNG’s history could be wound back through revenues from the PNG LNG project. The fall in LNG and other commodity prices undermined that hope. The 2015 Supplementary Budget and the 2016 budget commence a possible path to recovery. However, there are significant issues with the path chosen due to missed revenue opportunities, a lack of transparency on issues such as public debt levels and SOEs, and excessive expenditure reductions. It is the latter that is of particular concern. The planned 60% reductions in the economic sector, and 45% reductions to the health, education and infrastructure sectors simply do not seem credible in the context of an election next year, and they are not desirable either. More modest expenditure cuts, better prioritisation, and revenue reforms would have been a better alternative.
Paul Flanagan is a Visiting Fellow at the Development Policy Centre. Read the first part of Paul’s 2016 PNG Budget analysishere.