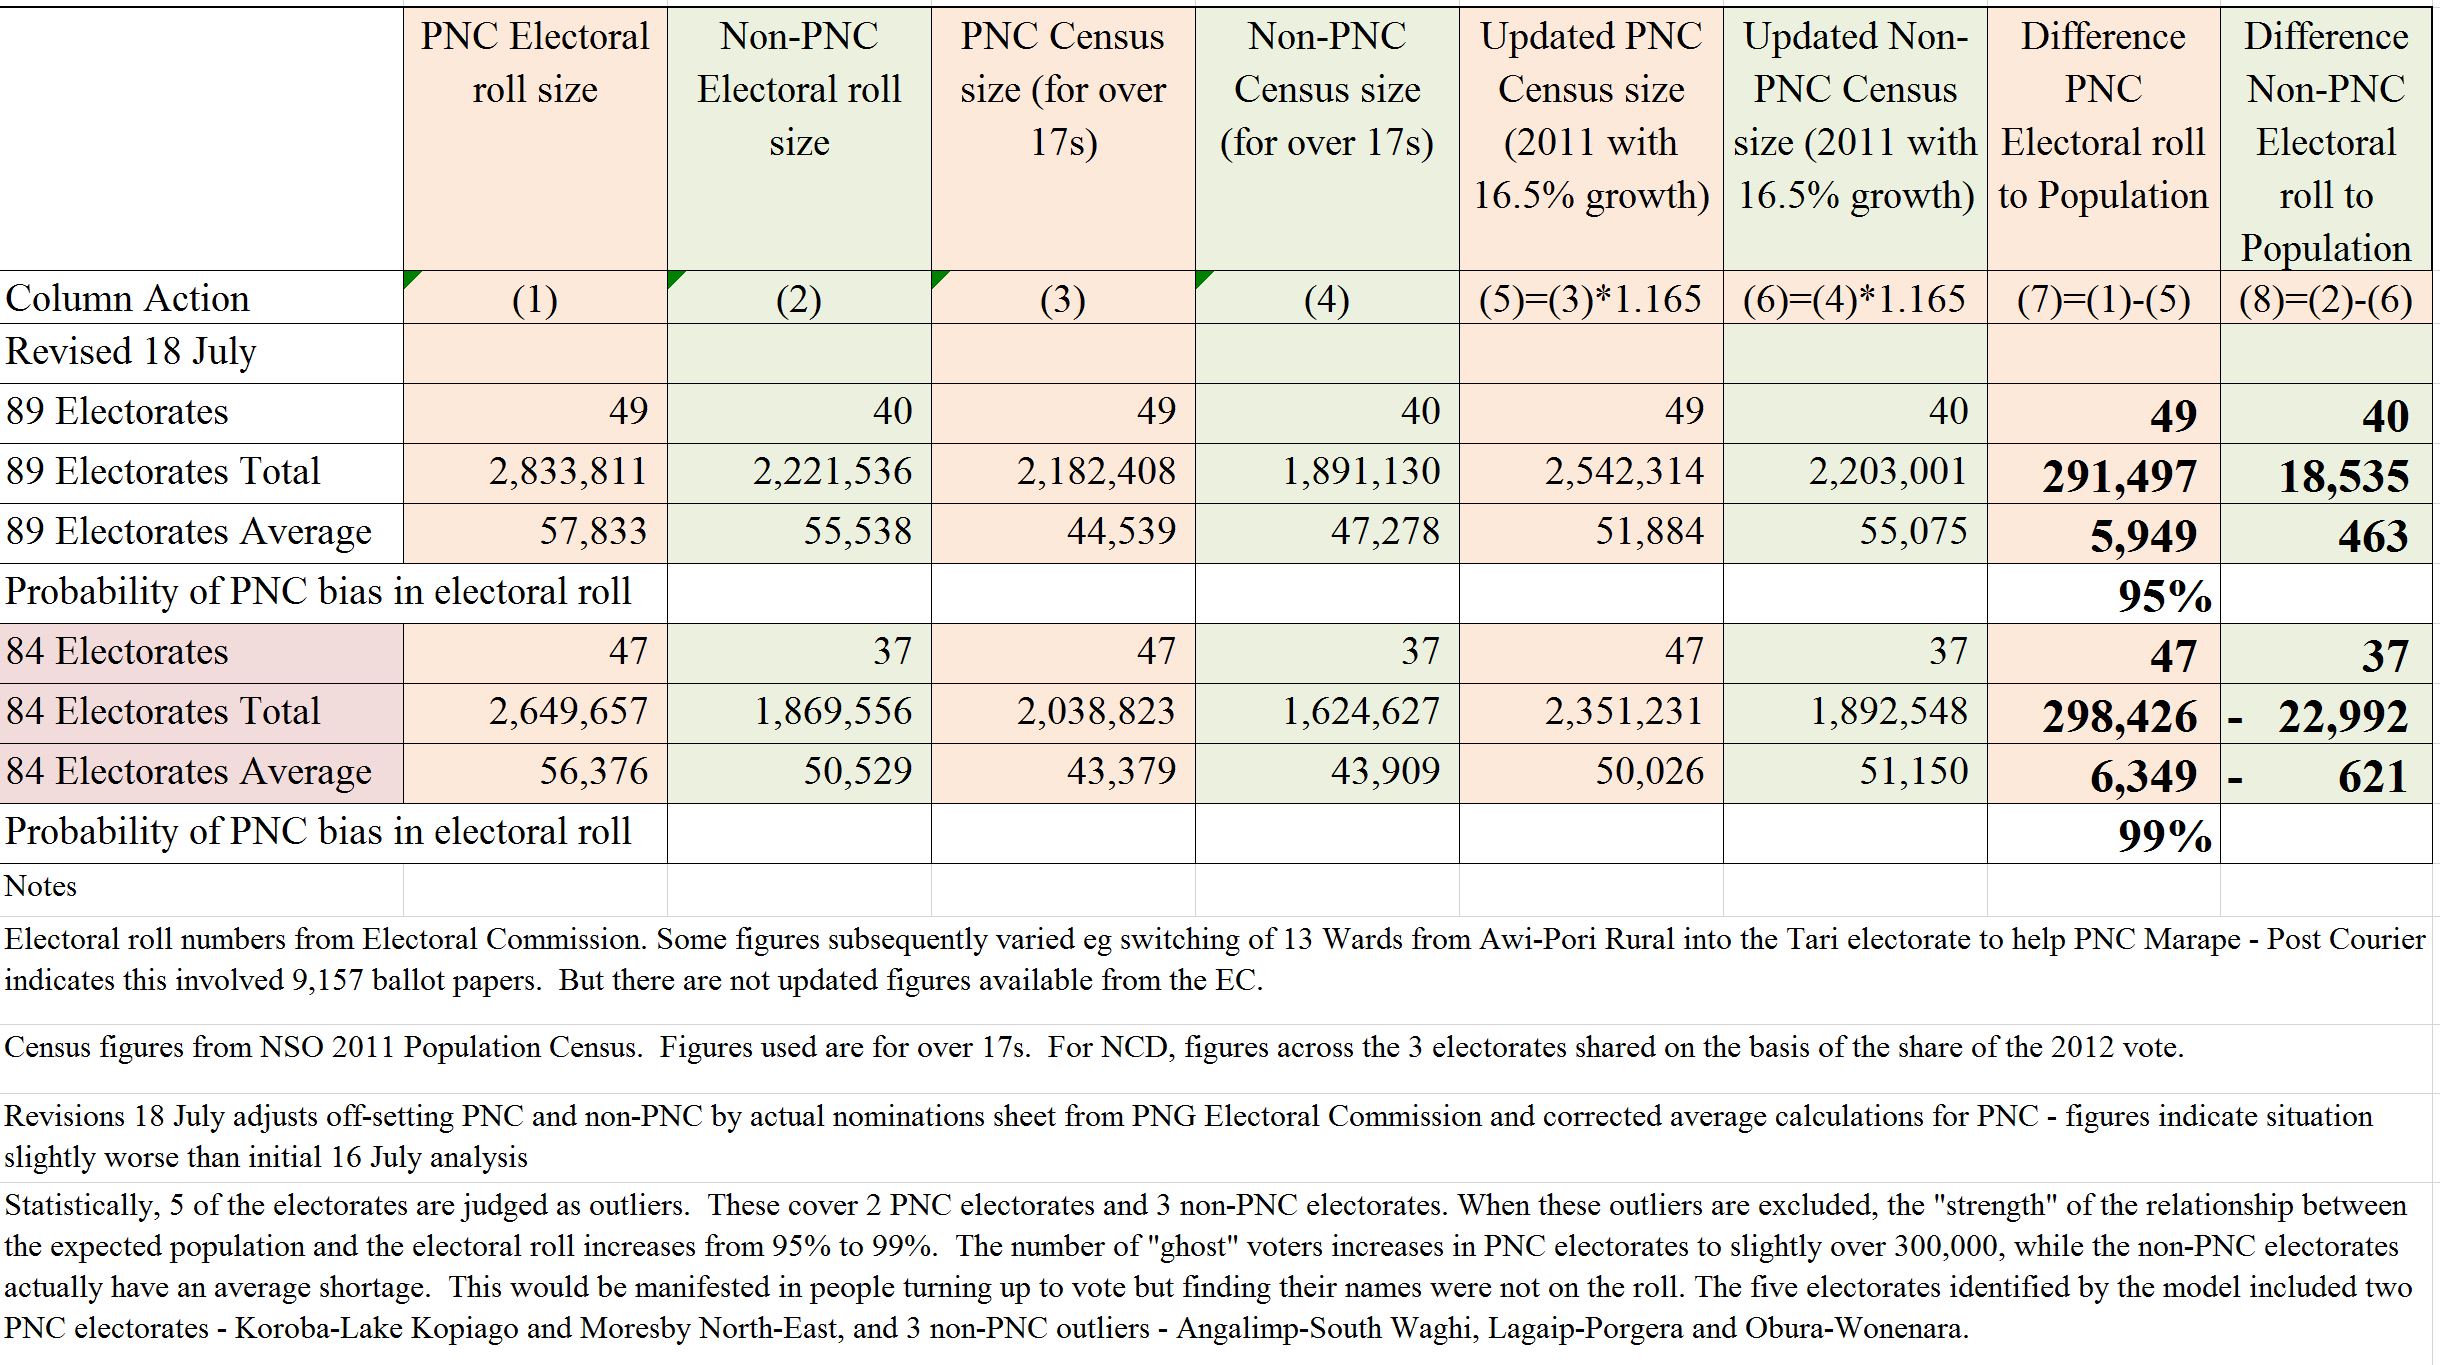
PNG’s election has unquestionably been biased in favour of the O’Neill government. The army of 300,000 PNC ghost voters, over 6,000 for every PNC electorate on average, is almost a statistical certainty – a level of gross manipulation that even surprised me.
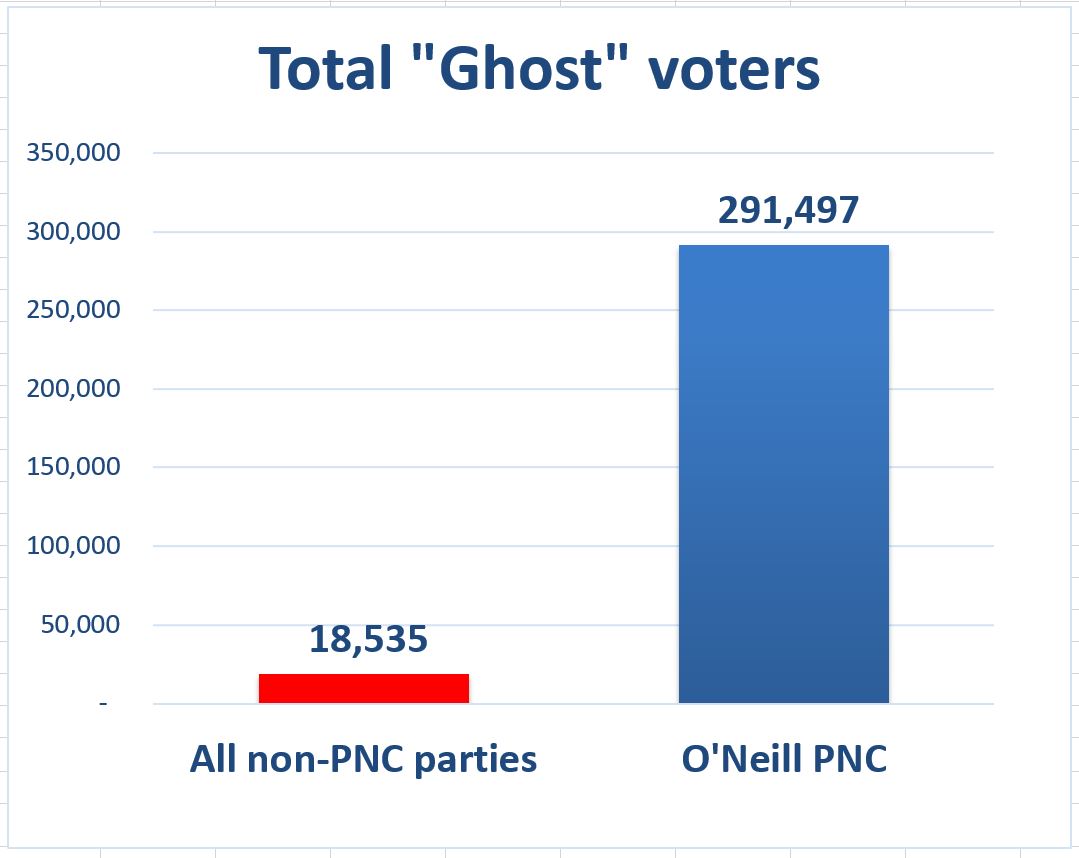
My last article indicated some extraordinary differences in the numbers of “ghost voters” (or “excess electors”, or “inflated rolls”) when comparing PNC electorates to non-PNC electorates. These were using simple statistical tools – totals and averages. This article provides more detailed statistical analysis of the likely pattern of bias.
These detailed statistical regressions (done by an independent expert) indicate a higher than 95% probability (so 19 chances in 20 – pretty high odds!) that the election has been biased in favour of the PNC.
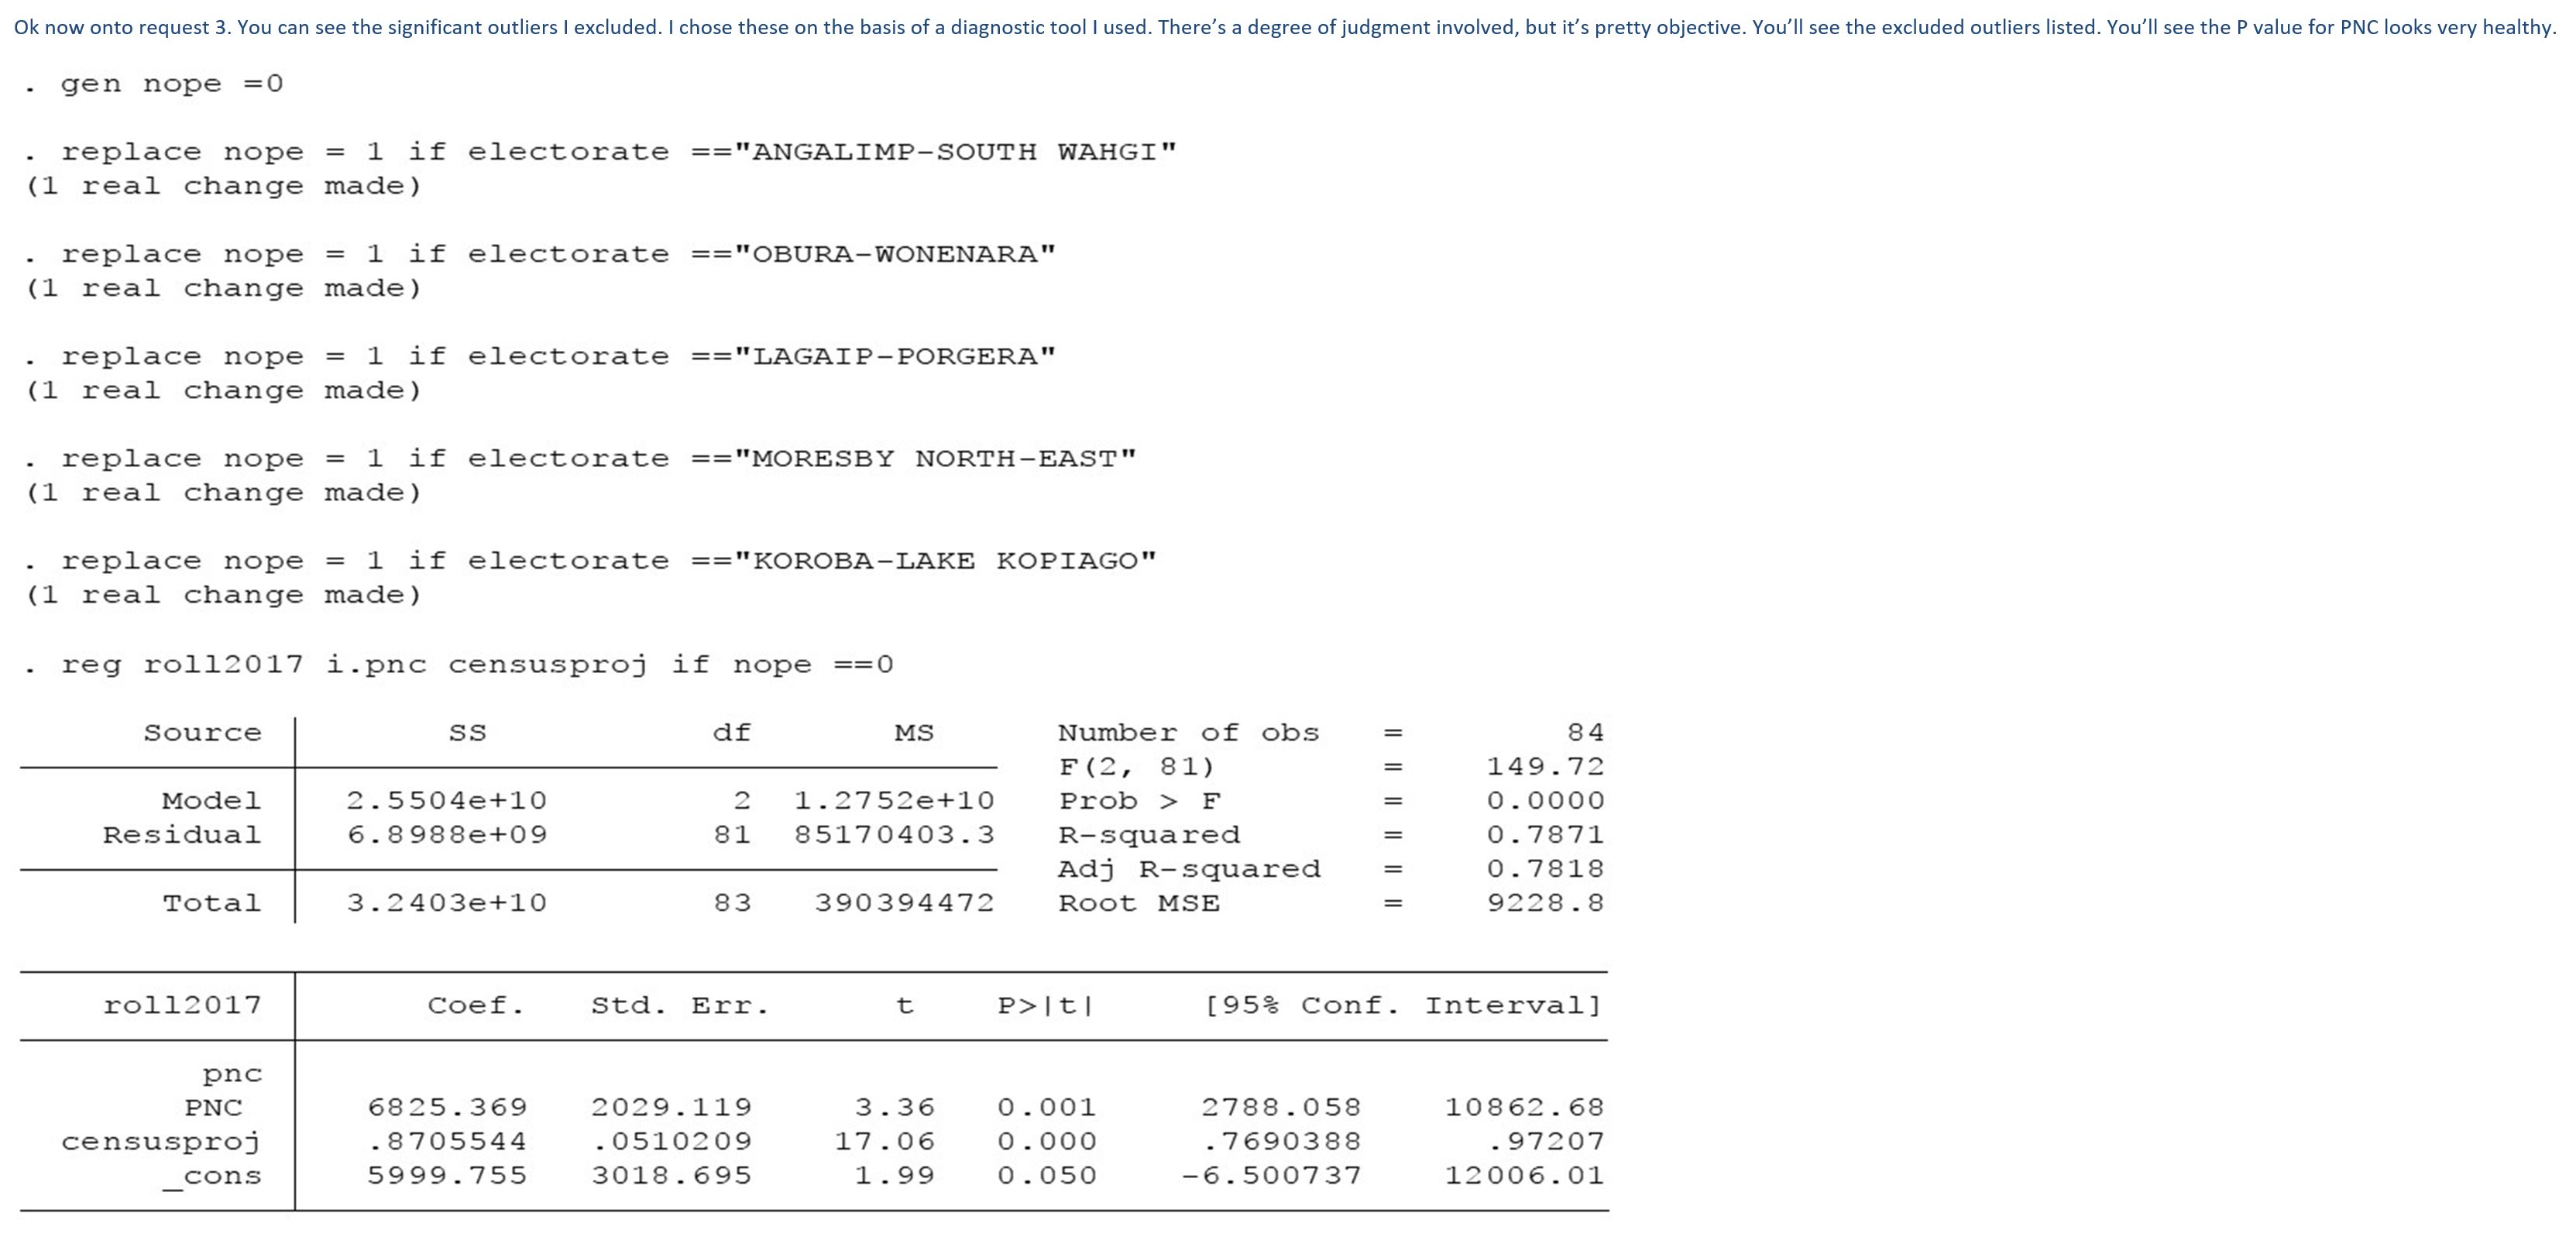
That figure is 99% when 5 statistical outliers are removed (so 99 chances in 100 – extraordinary odds).
This is an extraordinary pattern of bias – one rarely found in statistical analysis in the social sciences.
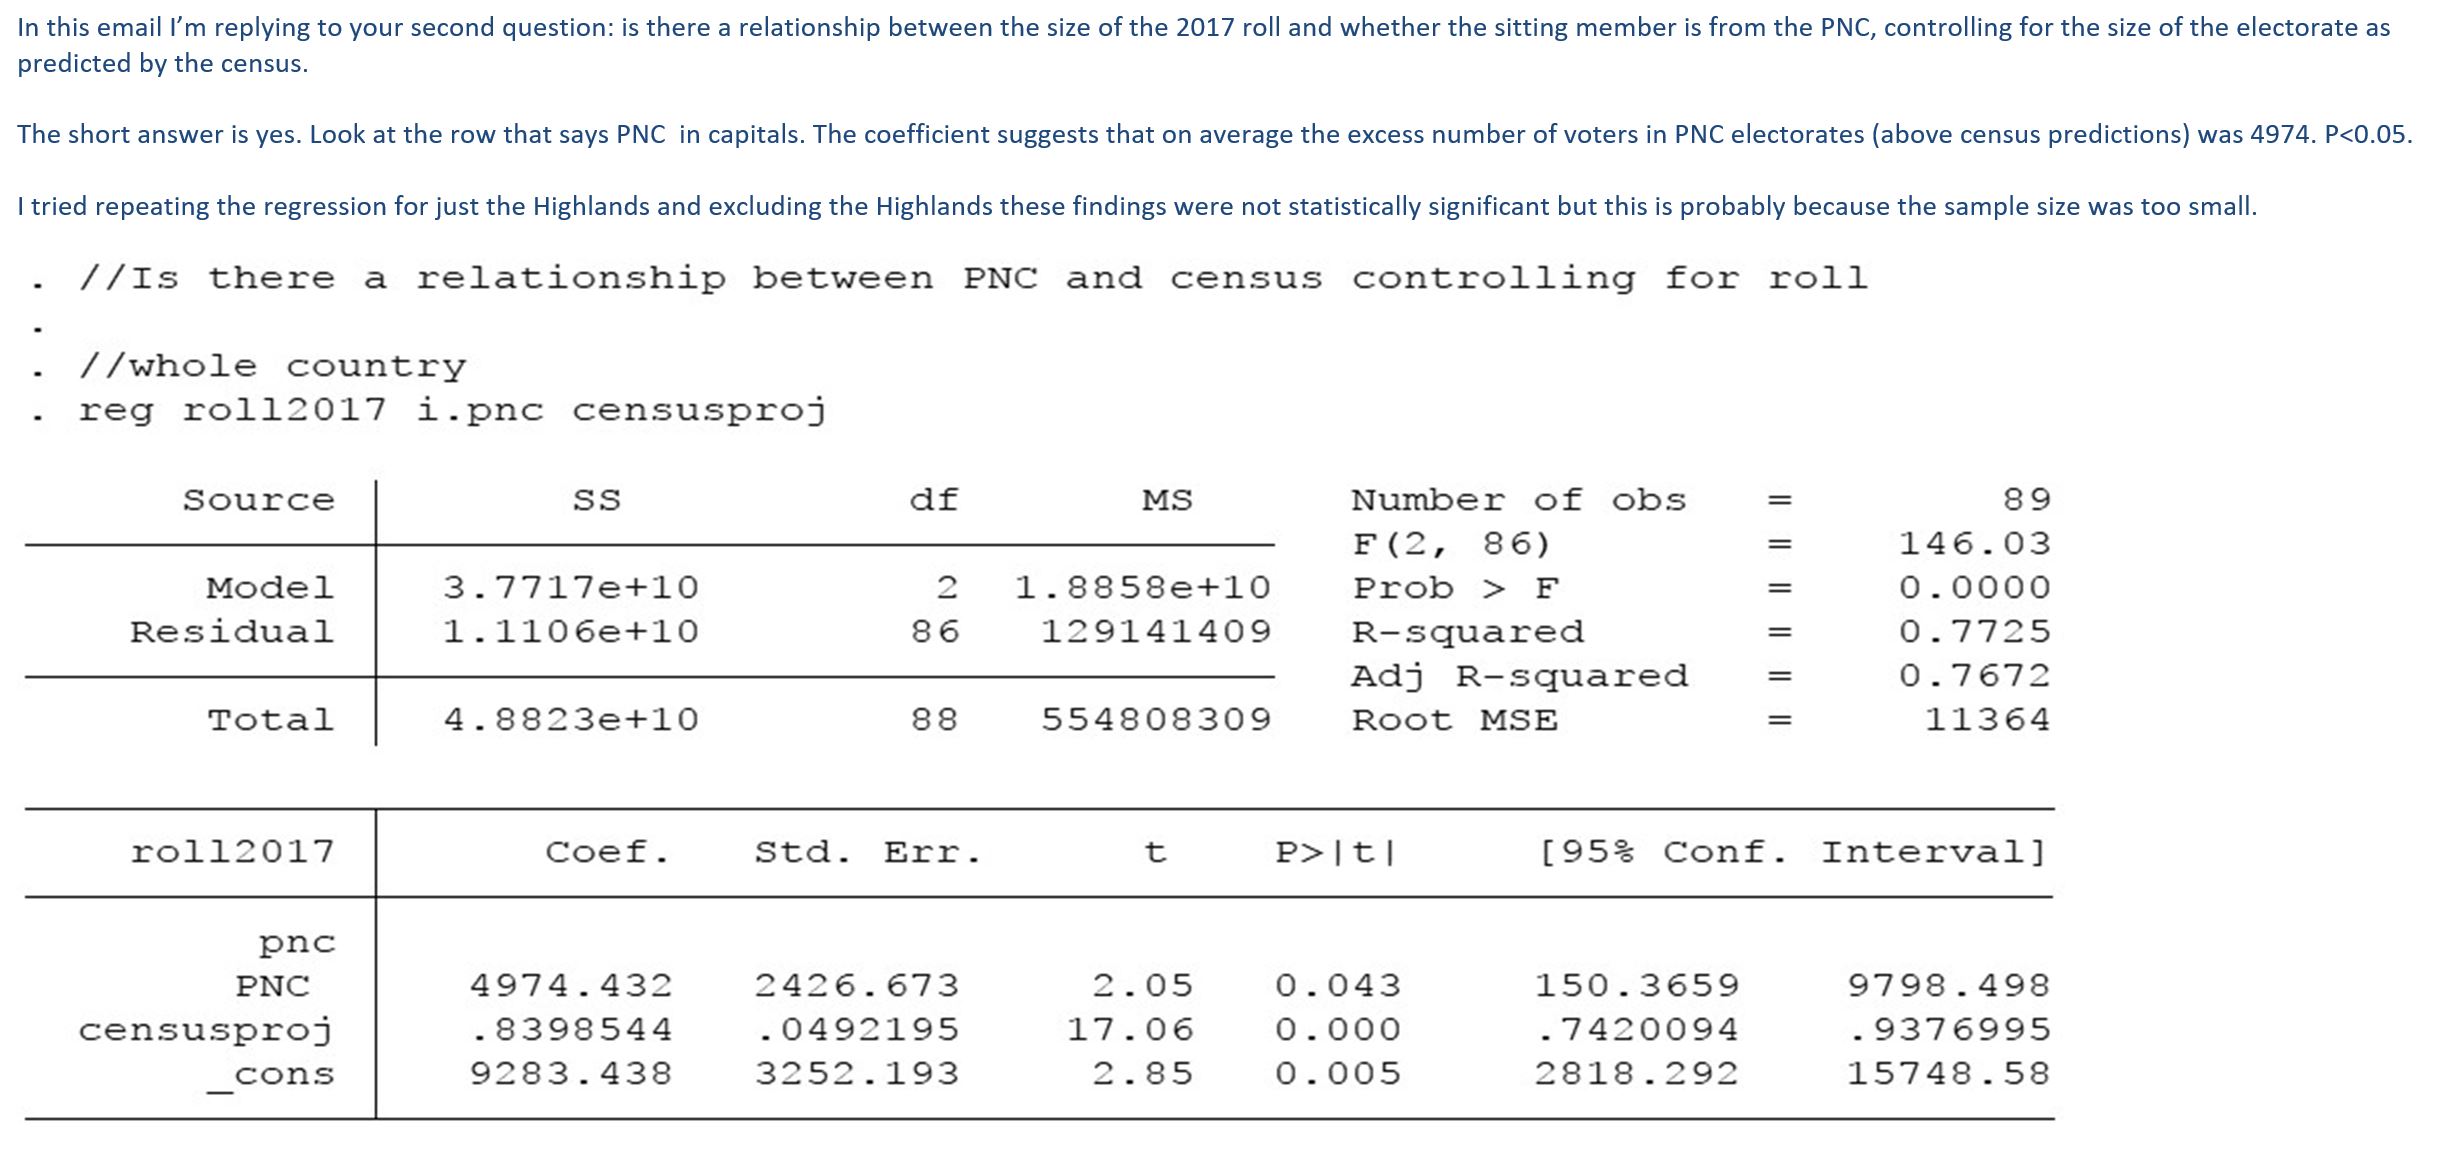
When determining statistical relationships, sometimes “statistical outliers” are identified. Five were identified by the model. This article includes figures both including and excluding these “outliers” – see summary table below.
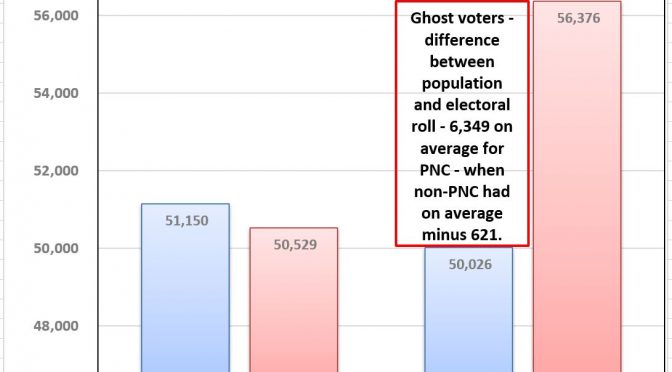
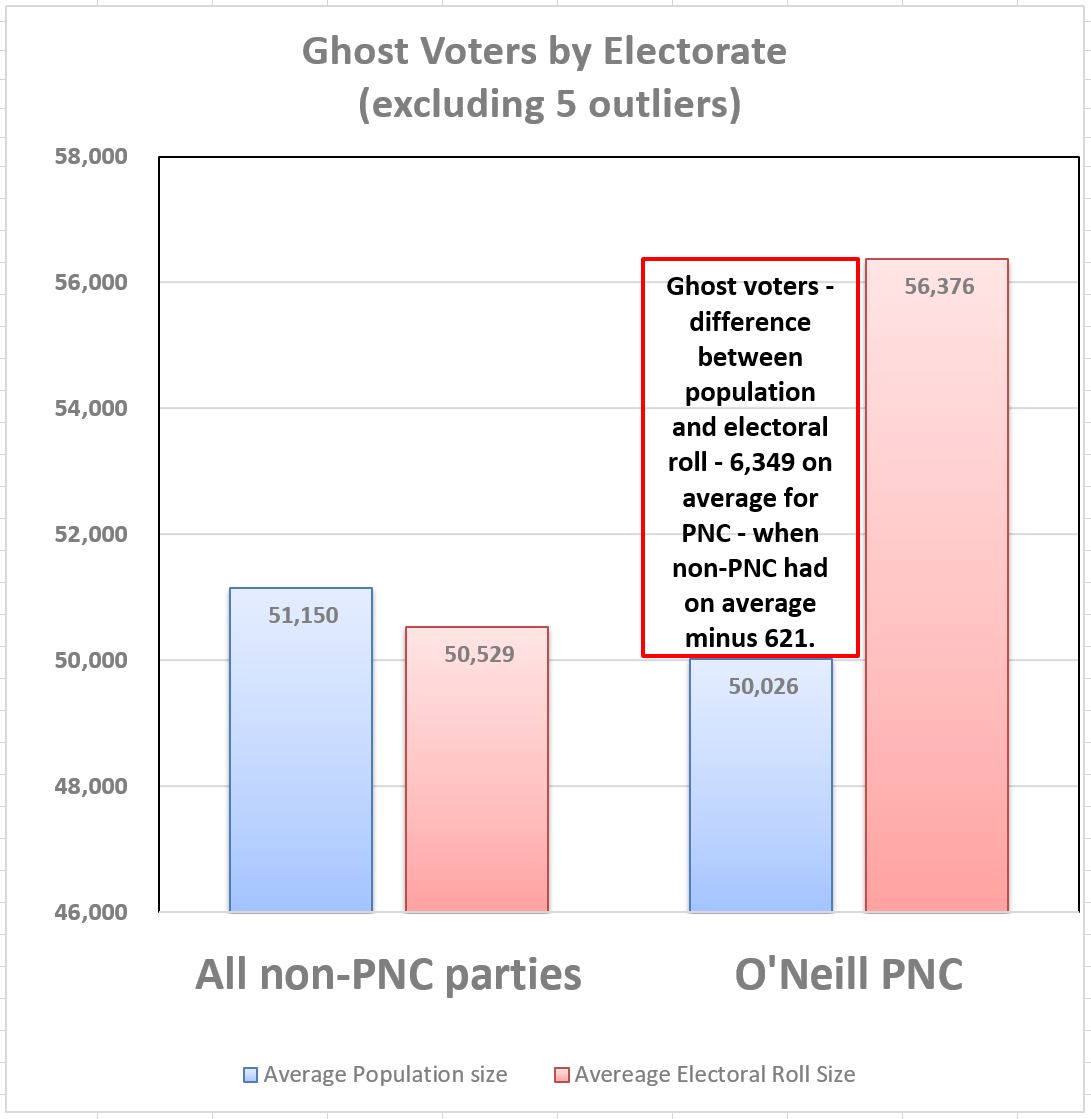
The following graph is based on excluding the 5 outliers – so on the remaining 84 electorates. It shows that the O’Neill PNC electorates had on average 6,349 ghost voters. Non-PNC electorates had a negative number of 621 – people would turn up to vote and find their names were not on the roll. Some of this is accidental or chaotic, but the statistical analysis indicates much of this is most likely deliberate – 99% most likely!
There will be many tricks ahead as the O’Neill government continues to play the advantages of incumbency (such as delayed counting and claims of failed elections in key areas where Morauta and Polye had strong claims).
Gamato needs to take responsibility for this biased election and resign.
The public has a right to know what actually happened to the 2017 electoral roll, the reasons for the chaotic distribution of ballots with inadequate numbers going to key anti-O’Neill areas (such as the universities), the very suspicious pattern of slow counting in potentially key alternative government strongholds, the reasons he has started to hide from the press and why he attacks commentators for simply using the same comparison he used on 9 April or figures he’s earlier distributed.
The Election Advisory Committee should reform and advise the Governor General, notwithstanding the limits on their power, which electorates should be declared failed. Ialibu-Pangia and Tari would seem prime suspects for being declared failed with unacceptable last minute gerrymandering and statistically improbable voter turnout figures.
My next blog will deal with the ludicrous attempt by Gamato to defend his biased practices in his Press Release on Friday.
Fortunately, the public backlash against PNC is so powerful that despite the clear bias in this election, there still remains a historic chance for change.
May the anti-O’Neill forces be able to find enough common ground to form a new government.
Details
Statistical analysis confirms PNC’s army of around 300,000 ghost voters.
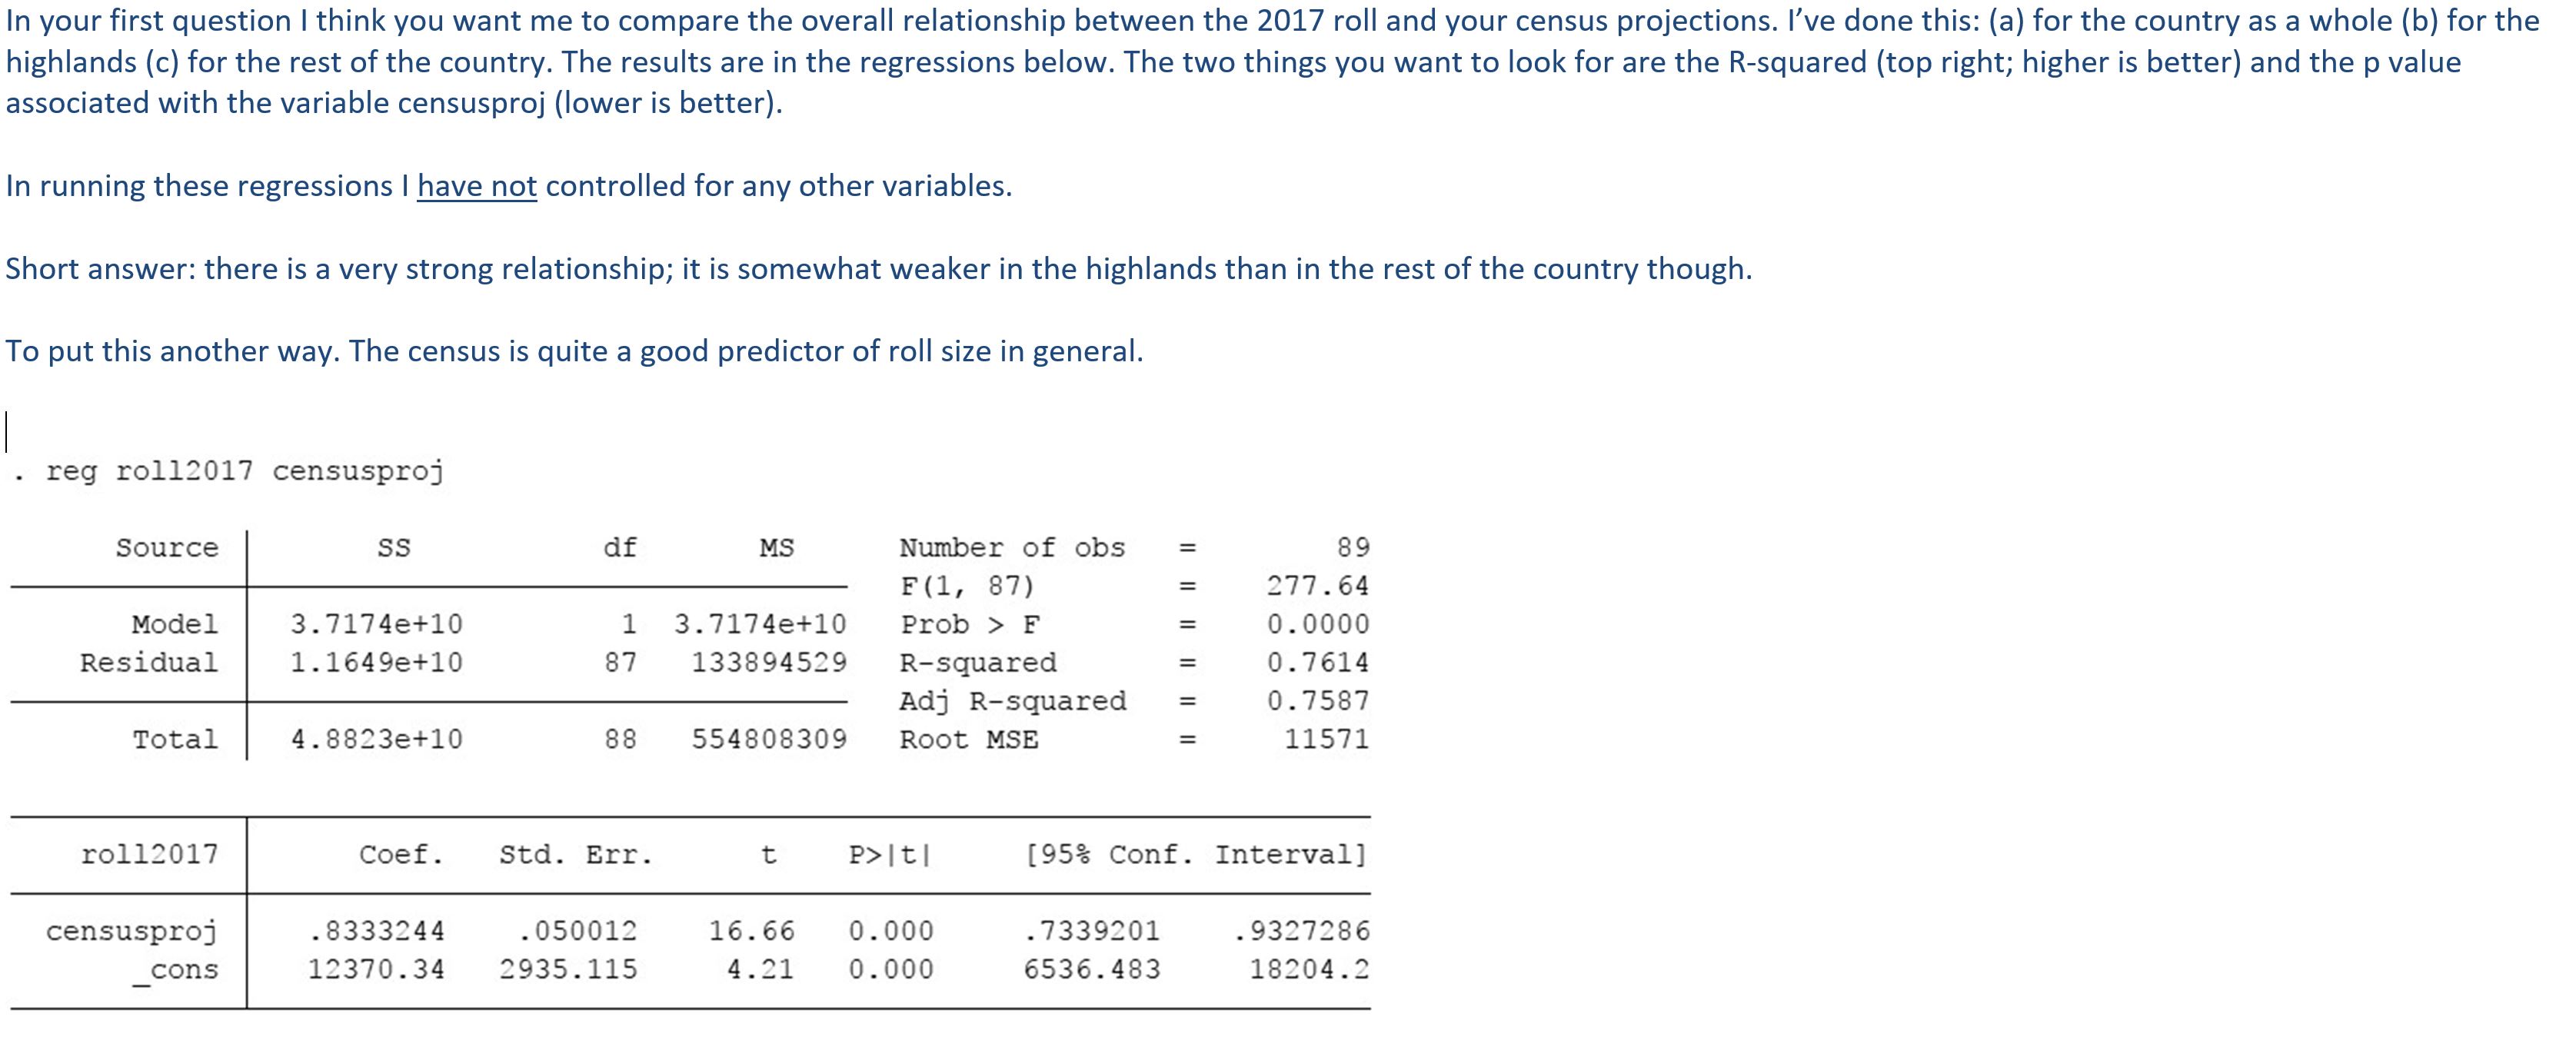
Regression analysis for the 89 electorates, with 49 PNC members standing for re-election, indicates a 95% probability that there is a bias in favour of the PNC (see results above and below).
The statistical analysis (by an outside expert) is set out in response to three questions -key figures are the P values – note descriptions of some PNC electorates have been updated since the earlier analysis based on the PNGEC nomination forms by party rather than the PNG Parliamentary website).
In determining relationships, statistical models can indicate “outliers” which are often excluded for the purposes of analysis. This model identifies 5 electorates as “outliers”. Excluding these, the probability of electoral bias in favour of the PNC climbs to an extraordinary 99%.
In the social sciences, yet alone medical science or other areas, it is extremely rare to get such a powerful relationship. Possibly there is some extraordinary explanation for why there is only 1 chance in a 100 that the 2017 election was not rigged. Releasing more information to the public at the LLG and Ward levels would allow more detailed analysis and greater certainty.
I had expected the devil to be in the detail – see here – but the manipulation appears to have been so extensive and clear that the bias shows up in even very aggregrated data. This is a shameful situation.
The Electoral Commissioner should take responsibility for this failure of the electoral roll – it was his job to get rid of “ghosts”. If that was too much to hope for, at least he should have had the ghosts evenly spread.
