
Executive Summary
- The 2017 Budget was a missed opportunity for restoring credibility in the Government’s economic management.
- Vastly different measures for GDP are included throughout the same Budget document – not a good look for international investors and credit rating agencies
- LNG values are assumed to increase in the 2017 Budget by 16% while recent World Bank forecasts indicate a fall of 35%.
- Using official BPNG figures, and updating them for the lower growth forecasts in the 2017 budget, a recession is confirmed:
- (using the measure most relevant for measuring progress on PNG’s living standards)
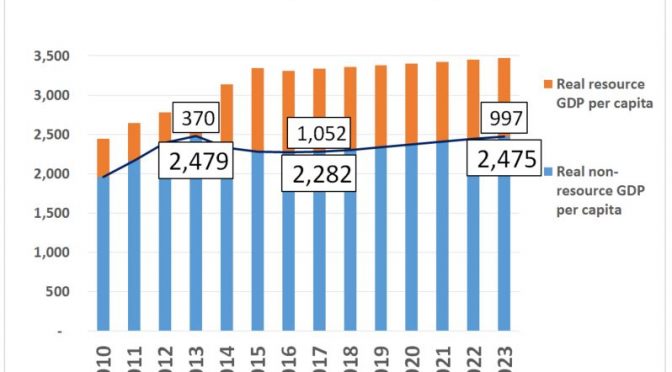
- real non-resource GDP per capita is expected to fall from K2,479 in 2013 to K2,282 in 201 7
- this is a fall of 8% in average living standards in PNG.
- According to official estimates from Treasury and BPNG, it will now take until past 2023 to get back to 2013 standards of living (see graph below).
- PNG is officially facing another lost decade of development.
- Economic management in PNG is not going well.
Detail
The 2017 Budget was a missed opportunity for restoring credibility in the Government’s economic management.
The government should have a strong understanding of past and future drivers of growth in the economy. This means being able to measure the economy’s size as accurately and consistently as possible.
Unfortunately, the 2017 PNG Treasury Budget is internally inconsistent and tells some very mixed stories. This matters, as it is a key measuring stick for assessing the government’s performance. The GDP figures are also key in determining whether PNG is meeting certain statutory requirements such as keeping its debt levels low.
Let us ask the simple question. According to the 2017 Budget, how large was the PNG economy in 2015, 2016 and 2017?
The key table for analysing PNG’s GDP is Table 1 on page 88 of Budget Volume 1. It provides the detail on what has been happening and is projected to happen in the economy. It breaks the economy into 10 key sectors and provides both nominal and real information on each of them from 2015 to 2021. These are the numbers that should drive PNG’s revenue estimation models. This is the table where it is calculated that PNG’s overall growth rate will drop from 11.8% in 2015 to 2.0% in 2016 and 2.8% in 2017.
The following table looks at the claimed nominal value of GDP from 2015 to 2017. Each line shows the claimed figures from relevant tables in the Budget’s statistical annex.
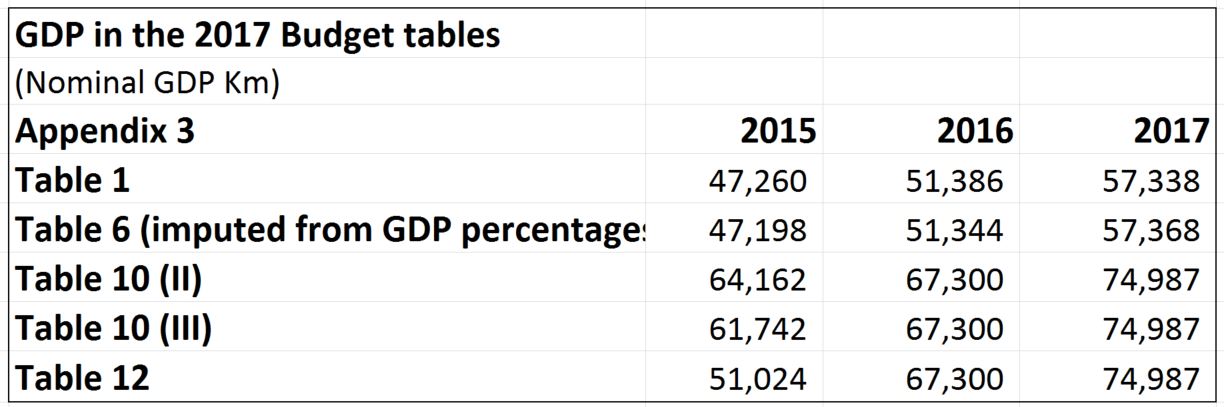
So the key Treasury analysis is still based on old GDP numbers – prior to the NSO updates. Despite this, the key budget ratios use the old Treasury GDP growth rates and (somewhat randomly) apply them to the NSO GDP updates. As the table above indicates, especially for 2015, this is a bit of a mess. This does not inspire confidence.
In addition, there are some technical issues in the 2017 Treasury GDP estimates. For example, there is no analysis in the 2017 Budget of why LNG prices are assumed to increase by 16% in 2017 (to $US8 /mmbtu). This is a key driver behind the increase in GDP forecasts in nominal terms (so the figure that affects calculations of debt ratios). In contrast, according to the latest World Bank Commodity Markets Outlook October 2016 p16 “Natural gas prices are projected to fall 31 percent in 2017, led by large declines in Europe (-39 percent to $4.4/mmbtu) and Japan (-35 percent to $6.7/mmbtu) as production cutbacks are resolved and demand remains subdued.” In contrast, oil prices are now forecast to lift to $US55 per barrel (so higher than the Treasury forecast of $US50 per barrel – but for a much less significant item in calculating GDP). Moving forecasts in line with the latest World Bank projections would have a net effect of lowering GDP by around K2 billion below the budget forecast.
Trying to unpack GDP numbers further (with a particular emphasis on non-resource GDP as most resource GDP simply goes to foreign investors and financiers) it is interesting to combine the latest BPNG figures on NSO related GDP (see here slide 3) with the latest 2017 Treasury Budget forecasts (from Table 1 Appendix 3 of the 2017 Budget).
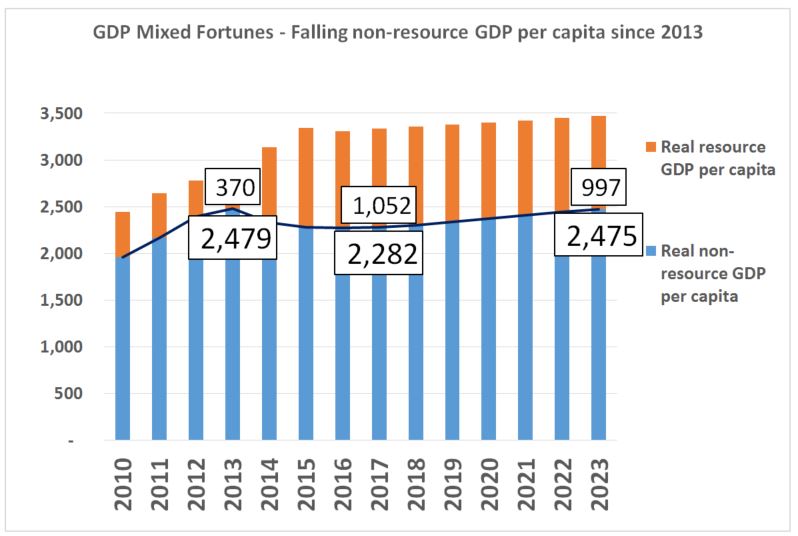
The BPNG numbers from Slide 3 provides an overall measure of Real GDP expressed in K bn from 2010 to 2016, a sectoral breakup of the economy (which allows the separation of resource GDP from non-resource GDP) and then real per capita GDP. The above graph uses those numbers through to 2015, and then updates them for the Treasury official forecasts. For example, the BPNG slide indicates Real GDP per capita was K2,849 in 2013. This is broken down into K2,479 in non-resource GDP and K370 resource GDP (when added together they add exactly to the BPNG number). By 2015, using simply the sectoral shares in the economy provided by BPNG, the total GDP per capita of K3,343 is broken into K1,059 for resource GDP (a massive increase due to the PNG LNG project) but a fall in non-resource GDP per capita to K2,284 (a fall of 8%). The above graph then uses the GDP growth forecasts from the 2017 budget with a conservative assumption of a 2% population growth rate from 2017 (the BPNG figures used a growth rate closer to 3%). This means there is little change in the structure of GDP per capita from 2015 to 2017 with the graph showing the 2013, 2017 and 2023 estimates (it complicated the graph too much to show every year).
So, and this is the worrying message that affects the well-being of most people in PNG, real non-resource per capita is expected to fall from K2,479 in 2013 to K2,282 in 201 7 – a fall of 8%. This is not good news at all. Indeed, given other sources of information (taxation receipts, employment, sales, profits, shipping levels – see here), I actually expect that the recession is much more severe than indicated in these official forecasts – at least 10% and possible 20% – so the second worst in PNG’s history (Bill Skase was PM in the late 1990’s which was PNG’ biggest economic disaster – it needed Sir Mekere Morauta to start fixing up the mess).
Using Treasury non-resource GDP growth forecasts, and allowing for population growth rate of 2% a year, it will now take, according to official estimates from Treasury and BPNG, until past 2023 to get back to 2013 standards of living.
PNG is facing another lost decade of development.
Of course, there are some upside growth possibilities from new resource projects. But these may be offset by downside risks flowing from the government’s anti-growth policies on the exchange rate and broader sectoral changes such as land, agriculture and SME policies.
Economic management in PNG is not going well.