
The “Double or Nothing” Jubilee Australia report on the PNG LNG project generated considerable interest and comment. Included within that was a request for more detailed information on the sensitivity analysis of the report (this analysis was mentioned on page 17 of the report, with 2 key alternative assumptions covered in Footnote 22). This information is provided below.
Consistent with the professional standards of “Jubilee Australia”, linked to the think tank of the “Australia Institute”, the draft report had to go through a peer review process. This earlier peer review process was concerned the analysis of nine alternative growth scenarios across two time periods was too long and technical for the key audiences for the report – and that was not economic research professors!
However, I considered enough detail was provided on page 17 of the “Double or Nothing” report to make clear for any technically minded reader (along with the transparent detail of Table 5) that on any reasonable assumptions of underlying growth rates, ACIL-Tasman’s muddled model lacked credibility and the conclusions from the Jubilee Australia (JA) were vastly more robust, transparent and clear.
The information included in the draft report (as ‘Appendix 2’) is below. In addition, looking at all the macro-economic indicators (rather than just GDP), the ACIL-Tasman analysis would have required negative growth every year for nearly a decade to support its claims of massive benefits. This is just not credible – the model was seriously muddled.
Looking through the final version of the report, there was a proof-reading error. As part of the peer review process, it was considered the term “baseline” was not clear enough. So through-out the 45 pages of the report the term was removed and more detailed language around “actual relative to underlying growth path” was included, with very clear indications of how that underlying growth path was determined. However, this update was not included in the relevant column heading in Table 1 (it was in Table 4 and the detailed Table 5) as well as one of the graphs. Apologies for not picking that up.
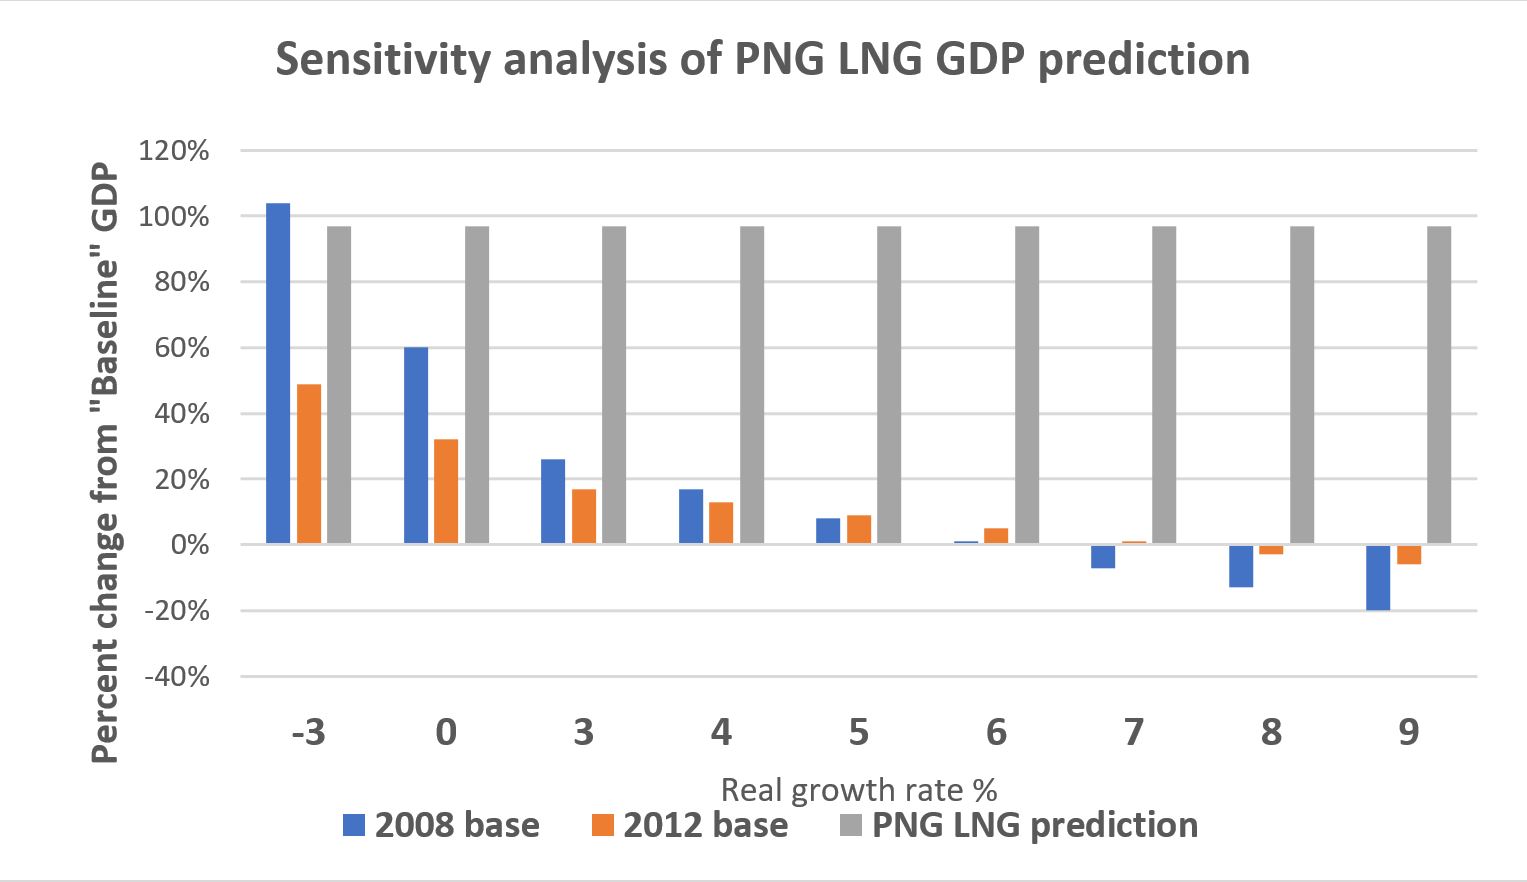
“Appendix 2: Sensitivity analysis for GDP
A key element of the PNG LNG economic model was comparing predicted outcomes relative to a “baseline”. Specific information is not provided on that baseline – it is the level of the economy expected at a particular point in time without the project compared with the same point in time with the project.
The basis for determining the baseline was discussed in Box 1 [a simplified version is now Appendix 2 of the Jubilee Australia report], especially for the most publicised “doubling of GDP” prediction.
The impacts of choosing different growth rates or different starting levels is explored in this sensitivity analysis. Different growth rates, from minus 10 per cent per annum through to a positive 9 per cent per annum, were used. The 2008 starting year was also compared to having 2012 used as the starting year. The results of this analysis are summarised in the Graph xx below. To get a figure close to the PNG LNG “doubling of GDP” claim which was frequently used by project proponents, the model would have had to assume the real growth rate was minus three per cent for every year from 2008 forward. This would have involved a decade of deep recessions. If 2012 was the base year, a negative growth rate of minus ten per cent per year would have been required. Clearly, this assumption did not match with the reality PNG or of almost any economy in the modern world. Even if a growth rate equivalent to just the population growth rate of 3 per cent was chosen, this still would have produced an outcome of only 26% above baseline from a 2008 base year, or 17% above baseline for a 2012 base year – still only a small fraction of the PNG LNG prediction of 97%. Even using a much more conservative growth figure (and one considered unrealistically low as explained below based on evidence from the time) this does not have a significant impact on the key theme that the PNG LNG model wildly over-stated the actual gains from the PNG LNG project.
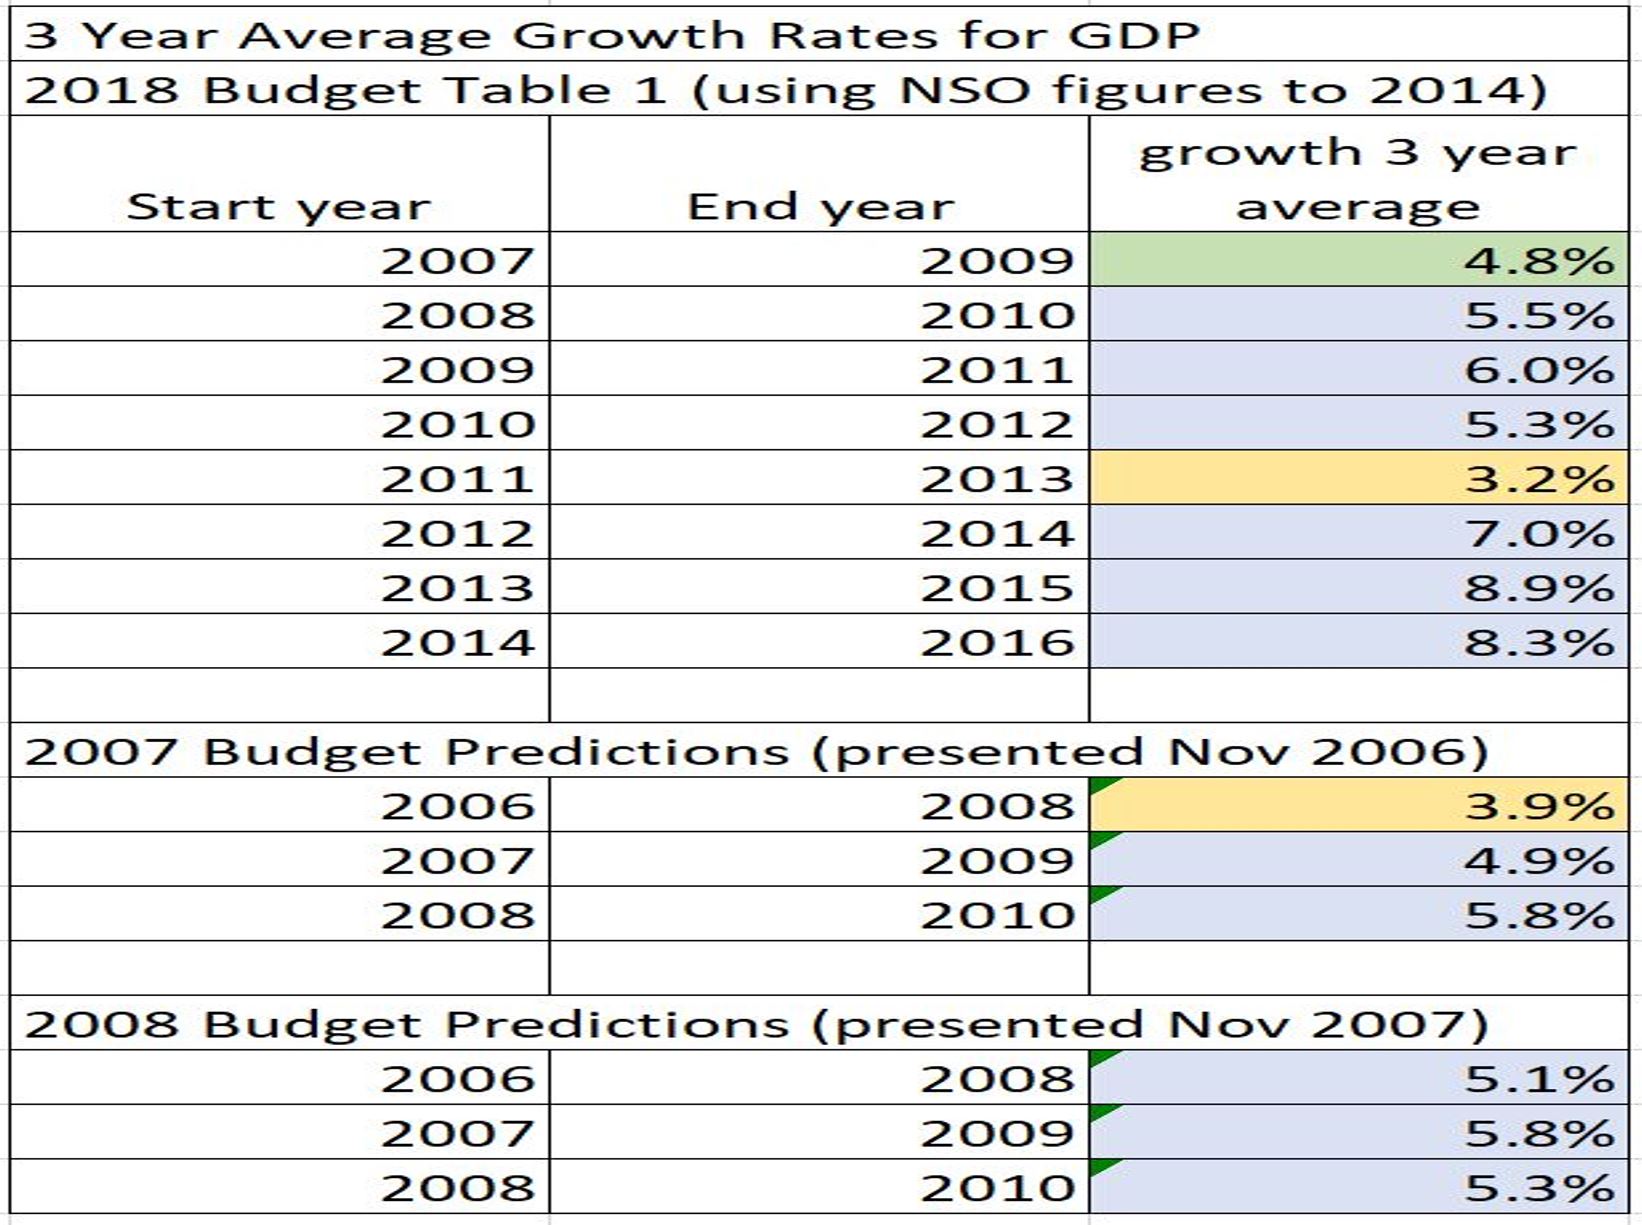
The following table examines the issue of the appropriateness of using a figure of 4.8% for the GDP growth rate – the average of the three years 2007 to 2009. Using the available data of all three-year weighted averages, it is only the years 2011 to 2013 which produces a lower real growth figure – the other six years are higher. Indeed, over these eight time periods, the average real growth rate was 6.1%. Comparisons are also made with three year average growth rates assumed from budget estimates at the time of the PNG LNG report. Once again, only one three-year average figure is less than 4.8% used in this report – the other five are higher and the overall average is 5.1%. In summary, the PNG economy was growing at around 5% in real terms during most of the 2000s. This was consistent with budget estimates at the time. It also implies a real per capita growth rate of just 2% per annum – presumably an absolutely minimum rate to improve PNG’s prospects and a rate that has been exceeded by PNG’s Asian neighbours. Using the 4.8% real growth assumption is considered robust, if not conservative, and using even lower growth rates would not change the fundamental story that the PNG LNG economic analysis of impacts is a very, very long way from what actually happened.
“