Summary
Using PNG’s updated GDP numbers, there are new insights into PNG’s economic history. In particular, they show how bad the last four years have been:
- PNG’s budget deficits over the last four years are the worst in PNG’s history.
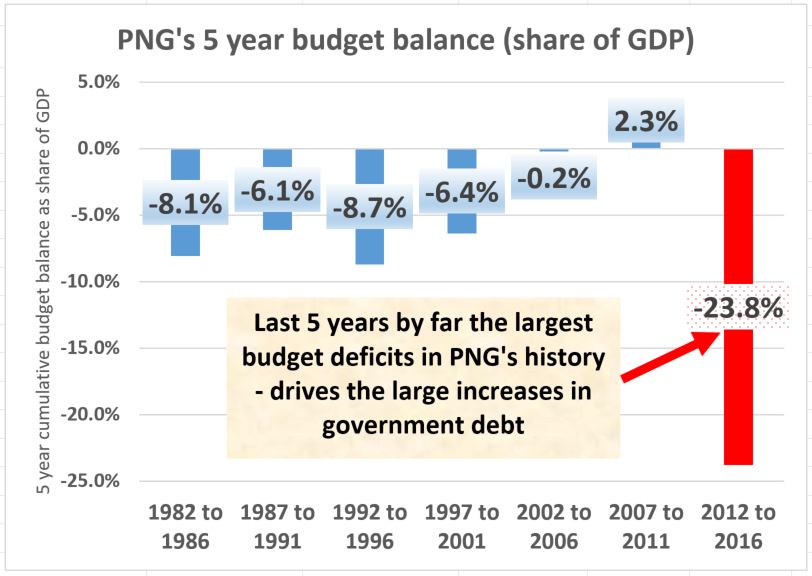
- From 2012 to 2016, deficits have totaled an extraordinary 23.8% of GDP
- This is nearly three times higher than the next worst five-year period for spiraling deficits (8.7% from 1992 to 1996 with five-year periods based on parliamentary terms).

- These daunting deficit figures are the driver behind the explosion in public debt from 17.3% of GDP in 2011 to 35.5% in 2016.
- In the 1992 to 1996 period, debt started at much higher levels (28% of GDP) but still didn’t reach 2016 levels (34.4% in 1996 vs the current 35.5% level using 2016 FBO numbers and IMF figures on 2016 GDP).
- There are two drivers for these historically high budget deficits.
- First, the massive increase in expenditure in 2012 was the largest in PNG’s history – and there was another substantial increase in 2013. Since 2015, the government has embarked on the most severe expenditure cuts in PNG’s history (earlier articles indicate that key areas such as health, education and infrastructure are being particularly cut).
- Second, there has been a collapse in revenues back to 1995 levels. Almost all of this reduction reflects the fall in growth in the economy probably resulting from exchange rate shortages and concerns about economic policies in areas such as land, agriculture and SMEs. Revenues are going down even faster than the government expenditure cutting which explains the increased in the deficit level from 2015 to 2016.
- As PNG is in an election campaign, I will not draw out the conclusions from the above analysis concerning the current government’s record on economic management.
Details
For those that know me, I have a deep interest in PNG’s economic history. A tok pisin version of earlier analysis is available here with the English version available here. A big issue for this analysis has been the dramatic increases in measured GDP (or size of the economy) by the National Statistics Office as well as the massive overstatement of recent economic growth rates by the current government according to the IMF – see here.
With a consistent GDP series now going back to 1980, it is now possible to examine some key economic indicators through time.
An earlier post examined the extraordinary falls of some 30% in average standards of living since 1980 (measured by real non-resource GDP per capita) – see here or in tok pisin here. This post examines some key budget (or fiscal) ratios.
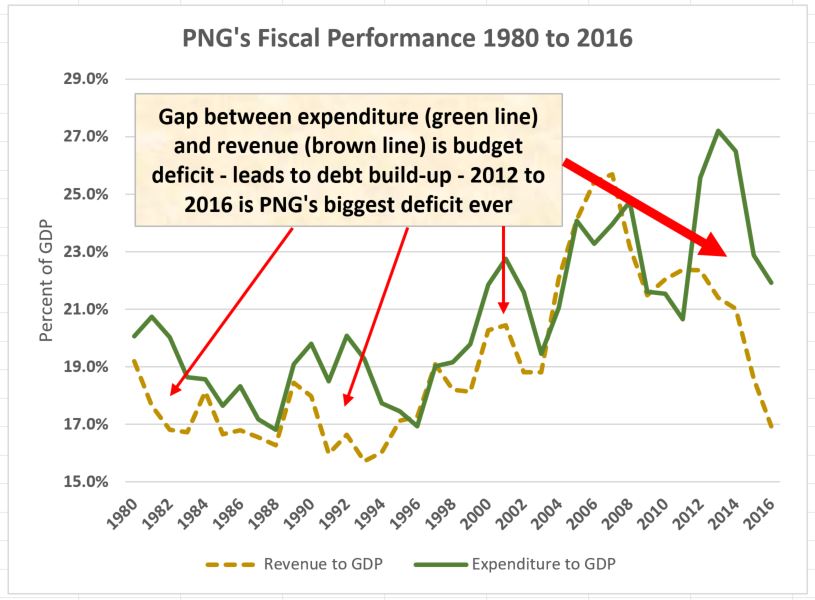
The following graph provides a high level summary of PNG’s fiscal performance from 1980 to 2016.

The green line shows the government expenditure to GDP ratio (source for all expenditure and revenue figures are PNG Treasury Budget documents). Essentially, it shows how large government spending is relative to the total size of the economy.
Over the last 36 years, there is a general pattern of the government spending more relative to the size of the economy – particularly from 1989 to 2014.
However, despite this increasing ratio, government expenditure has not kept up with population increases and inflation. This is a key factor behind falling service levels (in addition to issues such as weakening institutions, corruption, poor expenditure decisions).
Earlier analysis using the old GDP estimates suggested that PNG had government spending much higher than most other countries in the Asia-Pacific region. However, with the new figures, the levels of government involvement in the economy are much closer to PNG’s developing neighbours.
One feature of the graph is the large increase in the government expenditure share from 2011 through to 2014. This in part was based on counting the chickens before they were hatched – risky assumptions about the size of revenues from the PNG LNG project. This historic increase was followed by a historic decrease – a somewhat crazy roller coaster ride. As discussed elsewhere, the cuts made from 2015 are more severe than those imposed on Greece and they have, contrary to government statements, targeted areas such as health, education and infrastructure.
The revenue and grants line is shown by the brown dotted line. This line was in slow decline from 1980 through to the mid 1990s before it started growing through to about 2011. In particular, there was a ‘bump’ on top of this widespread revenue growth from the strong mineral revenues in the mid-2000s.
However, this line has fallen off a cliff in a way never before experienced by PNG. This reflects a collapse in tax revenues from outside of the resource sector, reflecting a major drop in growth and a likely recession. Of course the 2015 drought and the fall in commodity prices have had an impact – but these account for less than one-third of the fall in revenues relative to expectations – see here.
The gap between the expenditure line and the revenue line is the size of the government’s budget deficit (if expenditures are greater than revenues) or surplus (if revenues are greater than expenditures).
PNG has usually had a budget deficit – averaging about 1.5% of GDP. This is regarded as moderate for developing countries, and normal economic growth rates (in part based on good investment decisions) would comfortably cover such deficits without concerns about debt levels.
However, over the last five years, PNG has had its four largest deficits as a share of the economy in PNG’s history. Even the 2012 figure of a 3.2% of GDP deficit is the equal seventh worst in PNG’s history (matches the 1982 deficit) with 1992 and 1993 the in-between bad deficit years.
The top graph adds five years of government budget balances as a share of GDP. The 2012 to 2016 combined deficits of 23.6% of GDP are extraordinarily large – nearly three times higher than the next period on 1992 to 1996 (which included a severe economic crisis in 1994 to 1995).
These deficits have to be paid for by someone – and this is driving the doubling of PNG’s debt levels relative to the economy from 2012. Such a path is clearly not sustainable.
Future analysis with the updated figures will also examine some monetary aggregates and trade ratios. The aim is then to produce a more comprehensive update on PNG’s economic history.

