Executive Summary
The PNG LNG project is having a very negative impact on the PNG economy during its current production phase (2014 to 2035?). The most likely explanation for this is the poor “resource curse” economic policies by the O’Neill government induced by the project.
These negative impacts will continue to grow and by 2020 will swamp the initial GDP boost from beginning gas exports in 2014.
The project had a positive impact on the non-resource economy in the construction phase (2010 to 2014) – slightly greater than the level predicted by project partners of 5%. The boost to the LNG sector was almost exactly as expected. In 2016, its direct impact on GDP is a gain of some 14.4% – more than off-setting falls in the mining sector.
However, the policy implications of the project have been poorly handled by the O’Neill government. There was both a failure to capture the gains during the construction phase, as well as the introduction of policies than run directly opposite to recommendations on how to handle the potential “resource curse”.
Budget policy fell into the “presource curse” of spending before revenues were received and PNG has experienced its worst budget performance since Independence.
The exchange rate was locked in at an unsustainable level leading for foreign exchange shortages that are crippling the economy – reversing lessons from the 1990s.
Poor investment choices were made such as buying into Oil Search.
In a self-defeating attempt to support the agriculture and manufacturing sectors, PNG is moving back down a path of protectionist policies that will damage growth prospects.
Examining PNG’s policy responses over the last six years, these adverse policy choices are clearly linked to the PNG LNG project and inflated hopes of its potential.
The PNG economy should be able to sustain an underlying growth rate of 5% per annum. It did so with better economic policies, as well as some luck, in the period after the structural adjustment programs in the early 2000s. PNG’s people need better policies to return to at least a 5% growth path. Growing at 5% per annum for the next 15 years will simply return PNG to the level of economic welfare (real non-resource GDP per capita) that it had 35 years ago.
The easy path for hitting a big overall GDP figure by 2024 is to focus on more big resource projects – the potential resource “super-cycle”. A more sustainable and inclusive way forward is to focus policy attention on the non-resource elements parts of the economy. This is harder, and more indirect, but a much better option than the current boom/bust experiences of PNG’s resource curse. New resource projects could be promoted if they sustain-ably increase PNG’s non-resource potential. If the benefits mainly go overseas, then other options should be actively explored.
Key Results
The following graph shows the comparisons between PNG Treasury estimates of resource and non-resource GDP and a 5% trend line from 2008 (which is a conservative base as it was a recession year in PNG according to the PNG National Statistics Office with a negative change in GDP – reflecting the Global Financial Crisis).
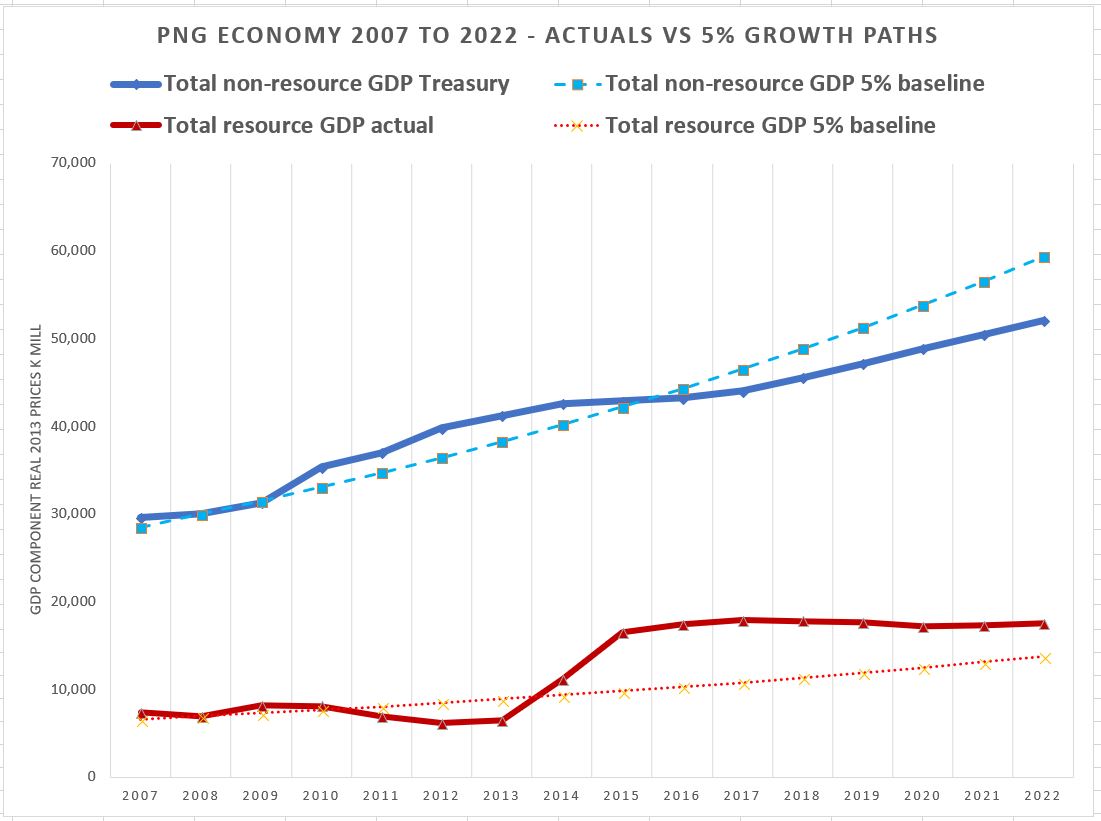
The gap between actuals and the underlying trend indicate how the PNG LNG project, and the poor “resource curse” policies that it helped induce, have impacted on the overall economy. These differences are summarised in the graph below.
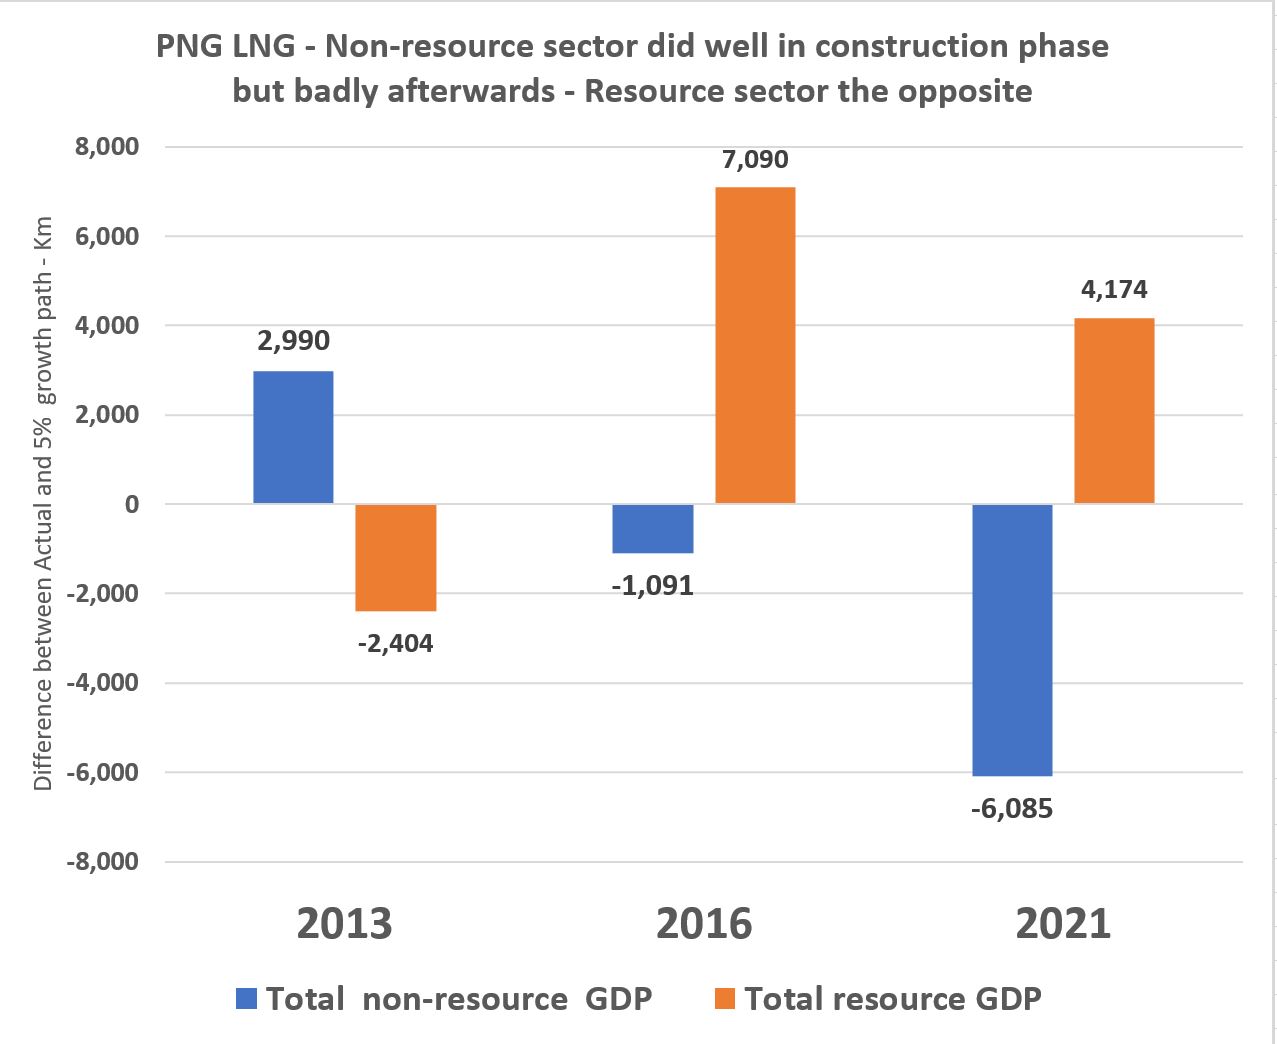
Overall, the important non-resource sector of the economy grew above an underlying trend growth path of the economy by K3 billion in 2013 – a gain of 8%. This suggests the ACIL-Tasman analysis estimates of a 5% flow-through to the remainder of the economy were slightly under-estimated.
At the end of the construction phase, the non-resource economy had moved below its underlying trend growth path by K1 billion in 2016 – so a fall of some 2%.
However, the turning on of the gas taps means that the way economists measure GDP (which has many limits) saw a jump in the resource sector of K7 billion higher than trend growth.
By 2021, using PNG Treasury GDP forecasts from the 2018 Budget, the non-resource economy would be some K6 billion lower than the underlying growth path, more than off-setting the still positive contribution from the resource sector (including PNG LNG) of K4 billion.
Key Sectoral Results
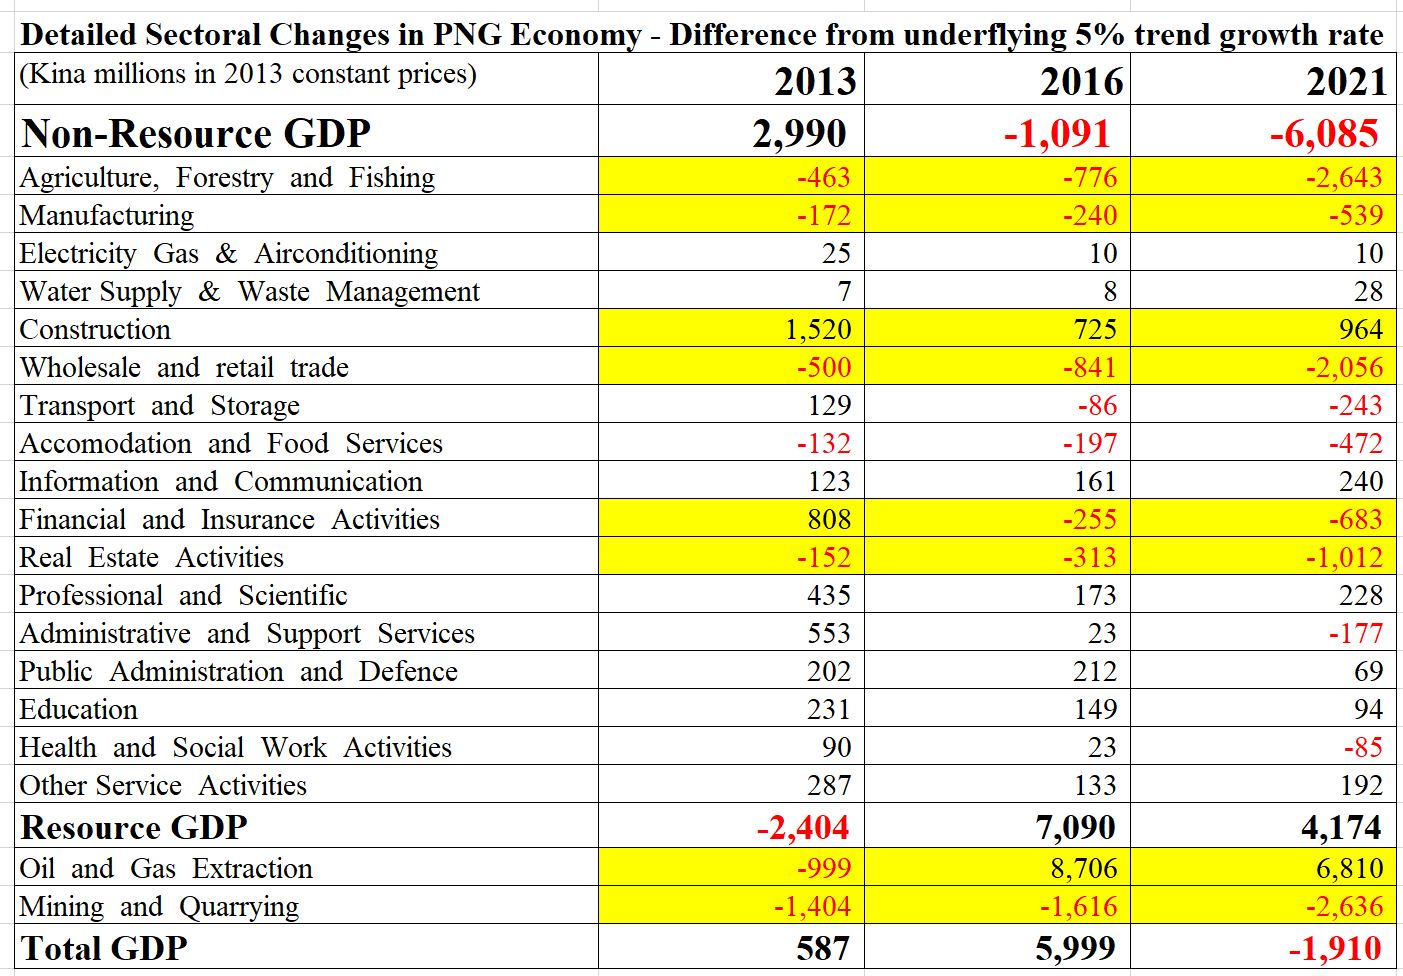
As expected for a new major resource project, the likely major indirect winner was the construction sector which has and continues to do well – an overall gain of some K1.5 billion per annum during the construction phase and still an estimated K1 billion by 2021. Other service sectors closely linked to the resource sector did well, although the gains are slowly receding.
Also as expected, losers were other parts of the economy involved in international trade – especially agriculture and manufacturing. These sectors have been particularly hard hit and have fallen to well below underlying growth trends.
More surprisingly, based on PNG Treasury figures, the project is having negative impacts also on the wholesale and retail trade sector, the real estate sector and (after the construction phase) even the finance and insurance sectors. These adverse impacts are likely driven by the resource curse policy responses induced by the project, especially the foreign exchange restrictions limiting imports and foreign investment.
Within the resource sector itself, the petroleum and LNG sector has done very well while the mining and quarrying sector has declined. This is an expected impact from a major new project (competition for scarce skilled labour, higher exchange rate costs) but given the relatively small size and concentration of the sector in just a few mines, it largely reflects the general decline in productivity of old mines (especially Ok Tedi) not being offset by new mines (such as Ramu Nickel).
These changes highlight how differently the PNG LNG project has impacted different parts of the economy.
PNG’s peoples would have been better off without the O’Neill government “resource curse” policies. Sections 5.4 to 5.7 of the Jubilee Australia report goes into considerable detail on how these poor policies were induced by the PNG LNG project.
These poor policies are keeping PNG below its growth potential conservatively estimated at 5% per annum. By 2016, and probably by 2015 based on new NSO GDP figures, the non-resource sectors were doing worse than if there had been no PNG LNG project and poor associated policies. For GDP as a whole, these negative policy effects are swamping the actual boost from LNG exports by 2020.
Overall, this analysis supports the earlier conclusion from the Jubilee Australia analysis that “There were larger indirect benefits during the construction phase, and some individuals and companies have done well, but overall the economy is in a worse situation than if
there was no PNG LNG project.”
Broad Methodology (details in technical appendices below)
This analysis builds on an earlier analysis of the PNG LNG project by Jubilee Australia (JA) which I co-authored with Luke Fletcher – see “Double or Nothing” report here. The focus was on a 2008 ACIL-Tasman economic analysis commissioned by ExxonMobil. In particular, it examined the predictions of expected gains relative to an underlying growth path in 2016 (the short-run predictions). These included predictions that GDP would be double the underlying growth path in 2016 – this analysis confirms the gain was actually about one-tenth that prediction – so about 10% rather than the absurd 100% predicted.
The JA report received considerable coverage – for example, it is the largest Business News story on PNG Loop in 2018. It was misunderstood by some, possibly deliberately in an attempt to discredit the analysis. There have been some subsequent clarifications (see here and here) such as the fall in oil prices does not explain the broken promises of the project, and a lack of understanding that the analysis did not deny there were some benefits for many, but the helicopter view of the whole economy indicated that there were net adverse impacts due to induced poor policies.
This analysis also includes a different but related approach. Rather than assessing the ACIL-Tasman predictions (which were outrageously optimistic and flawed), the focus is on how the PNG LNG project has affected PNG’s sectors through time, with a particular focus on 2013, and current PNG Treasury predictions for 2016 and 2021. These are compared with a reasonable underlying policy growth policy goal of 5%. The earlier ACIL-Tasman analysis was based on a model of the PNG economy that was outdated and did not directly link to current measures in the PNG National Accounts. This analysis is based on current PNG Treasury and PNG National Statistics Office views of the sectors of PNG’s economy – including details omitted in the ACIL-Tasman analysis.
In making an assessment of the impact of a major new project such as PNG LNG, there is a need to form a view on how the economy would have gone without the project. This is why the ACIL-Tasman also used an “underlying growth trend”. No economy stands still – if there were no more resource projects in prospect, the PNG government would focus on other areas to get the economy going. If a government didn’t look for other ways to get the economy growing, they would have little chance of being re-elected (unless they undermined election integrity). The focus would move to other potentials of the PNG economy – its people and its physical characteristics. Relative to other countries, PNG actually has greater absolute advantage in areas such as cultural richness, biodiversity and soils than it has in mineral, petroleum and LNG riches.
This analysis assumes PNG has an underlying growth rate of 5%. This is in line with trends over 2007 to 2009 – immediately prior to the large ramp-up in PNG LNG construction activities (there were activities prior to this but they were small in terms of the economy). 5% is in line with PNG Treasury expectations in 2007 and 2008 based on there being no PNG LNG project (see technical appendix below). Even with a 5% growth rate, it will take 15 years simply to get back to the real non-resource per capita level in 1980. A 5% growth rate is also the target set by PNG’s Opposition in its response to the 2018 Budget.
Following on from the Jubilee Australia analysis, this blog is an overall, “helicopter” view of impacts of the project based on economic sectors. There have clearly been a range of direct benefits from the project ranging from employment opportunities, local contracts, some revenues (although much less than expected), and provision of local community facilities including health provided by project partners such as Oil Search in the Tari hospital. At an economy-wide level, these direct benefits need to be measured also with other indirect benefits and direct and indirect costs (including those highlighted by the JA report “On Shaky Ground“).
This helicopter view examines how each sector of the economy has performed since 2008 relative to an assumed underlying growth rate trend of 5%. Differences above or below this 5% underlying growth trend provide insights into the direct and indirect impacts of the PNG LNG project. Some sectors have done well but most have not, especially as the project moved from its construction phase to its production phase.
Technical Appendix
-
Basis for 5% growth rate
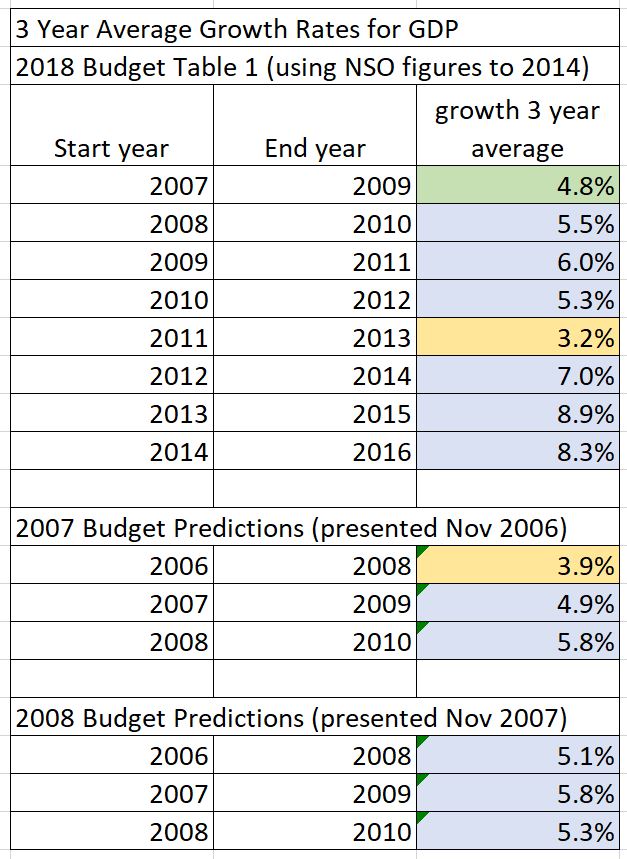
The following table examines the issue of the appropriateness of using a figure of 5% for the GDP growth rate. The table is based on an earlier appendix in the Jubilee Australia (JA) report but was omitted for reasons of length. The JA report used a figure of 4.8% for GDP as a whole and 5.3% for non-resource GDP. These figures were derived from the average of the three year real growth rate prior to the start of the construction phase of the PNG LNG project ie 2007 to 2009.
Using available data of all three-year weighted averages, it is only the years 2011 to 2013 which produces a real GDP growth figure lower than 5% – the other six years are higher. Indeed, over these eight time periods, the average real growth rate was 6.1%. Comparisons are also made with three year average growth rates assumed from budget estimates at the time of the PNG LNG report. Once again, only two three-year average figure are less than 5% used in this report – the other four are higher and the overall average is 5.1%.
The Governor of PNG’s central bank recently indicated that he considered PNG’s sustainable annual growth potential was 6 to 7% – see here. On the other hand, the most recent IMF analysis of the economy (2017 IMF Article IV) dropped the long-run potential growth estimate from 3.4% to 3.1% – presumably reflecting what is possible on current poor policy settings. PNG’s development plans and aspirations are based on growth rates in the 7 to 8% range (and even higher if the Vision 2050 aspirations are still in place). PNG’s Shadow Treasurer, in his response to the 2018 Budget, indicates that the PNG Opposition has an economic target of a 5% growth rate for the non-resource elements of the economy within three years of gaining office.
A 5% growth target is a key choice in analysis. Does one base growth projections on a period of good growth in the PNG economy relative to its historic averages? 5% has been achieved. Such a level is the minimum required for at least 15 years to bring PNG back to its level of economic welfare per capita in 1980.
In summary, the PNG economy was growing at around 5% in real terms during most of the 2000s. This was consistent with budget estimates at the time. It also implies a real per capita growth rate of just 2% per annum (so 5% growth less 3.1% population growth) – presumably an absolutely minimum rate to improve PNG’s prospects and a rate that has been exceeded by PNG’s Asian neighbours. Using the 5% real growth assumption is considered robust, if not conservative, and using even lower growth rates would not change the fundamental story that the PNG LNG economic analysis of impacts by ACIL-Tasman is a very, very long way from what actually happened.
2. Implications of different trend growth rates and GDP estimates
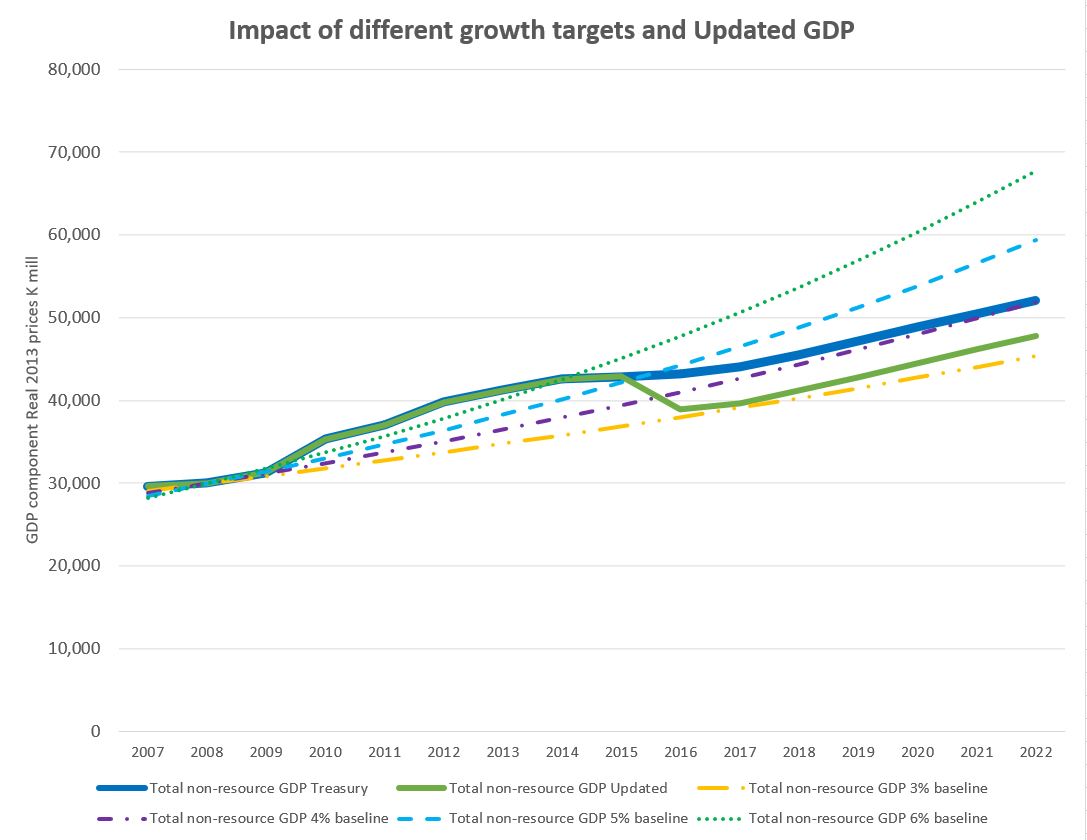
This section examines the implications of using different underlying growth rates as well as different GDP estimates. In the following graph, four possible growth rate trends are examined – 3%, 4%, 5% and 6%. These are shown in the dotted and dashed lines. The focus is on implications for the important non-resource elements of the economy.
As can be seen from the graph, and as expected, if the underlying growth trend is higher at 6% (the top dotted green line) then there is even a larger gap in lost opportunities. With lower trend estimates, the measured impact of the PNG LNG project and current policy settings are considered more positively.
Another factor in making the above assessments is the actual size of GDP. The figures in this paper use the PNG Treasury estimates from the 2018 Budget (Table 1, Appendix 3, Volume 1). However, the NSO has indicated that the estimate for 2015 overstated nominal GDP by around 10% or K5.1 billion. This is a massive variation, and confirms earlier suggestions that the PNG economy was actually in a recession in 2015. In addition, following a gain in 2016, recent data from BPNG indicates the economy could have slid again into a recession in 2017 based on falling employment, sales and private sector investment – although tax revenue growth and import growth suggest at least some positive growth. Putting these together, with the NSO figures built into non-resource GDP and a further K2bn reduced from the 2017 Treasury estimate, we get “updated GDP” estimates as shown by the solid green line. In this case, the PNG economy has fallen even further behind the 5% underlying growth line, significantly below the 4% underlying growth line (purple dot dash) and only just above the 3% growth line (which is less than PNG’s population growth rate).
This analysis has applied a consistent growth trend of 5% across both the resource and non-resource components of the economy, as well as for each sector. In the JA report, each sector had its own trend growth rate based on the period 2007 to 2009 but many sectors were not covered by the ACIL-Tasman analysis – largely because information for many sectors was only released by the NSO in 2016. Using the new NSO sectoral information (which is now used by the PNG Treasury GDP estimates for the first time in the 2018 budget), the average annual sectoral growth rates from 2007 to 2009 are shown in the table below.
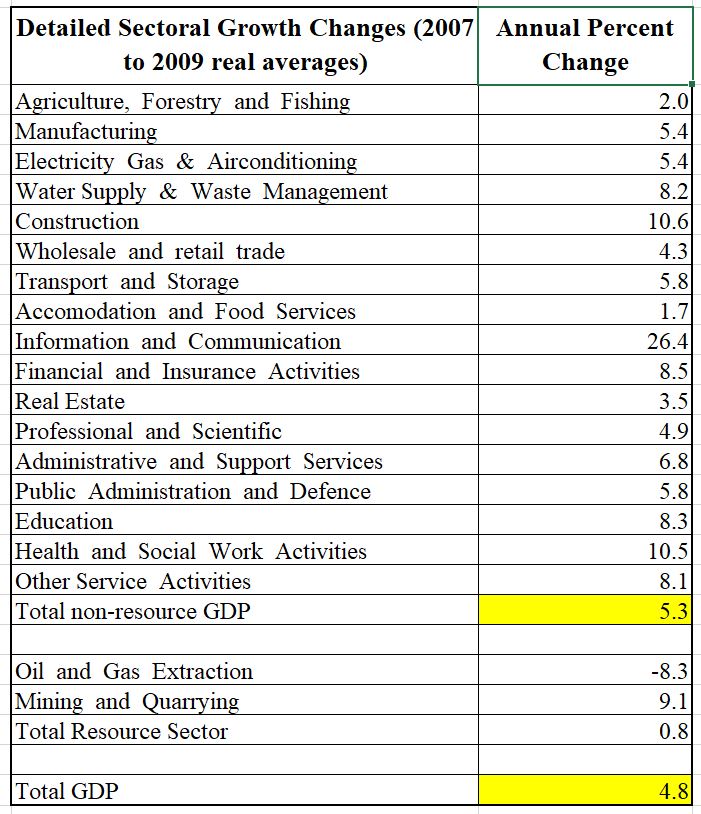
When using some of these figures, especially when projecting out for thirteen years from 2008 to 2021, it was unlikely that some sectors would continue growing so strongly. This is especially the case for the 26% real annual growth figure for the “Information and Communication” sector (a sector not covered in the ACIL-Tasman report). Doing so would imply the sector would grow 20 times larger over the course of 13 years. The Treasury Budget figures indicate the average growth rate from 2010 to 2021 is exactly 5% per annum for this sector. The over 10% real growth per annum figure for the construction sector was also unlikely to be sustained for such a long period considered by this analysis (13 years). On the other hand, the low growth figure for the agriculture sector would hopefully have been improved upon (the ACIL-Tasman report only looked at agricultural export figures – not the national account figures for agriculture). There is also the inevitable mathematical issue that growing sectoral components at very different growth rates means that they do not add to the aggregate figure as the composition of GDP moves further away from measured actuals. This was less of an issue when examining the ACIL-Tasman analysis as it did not cover all sectors – so there was no opportunity to examine the sectoral information with key aggregate information. Using a consistent 5% growth path does impact some of the JA analysis for particular sectors, especially those with sectoral growth rates significantly different to 5%. In particular, the construction sector is estimated to be above a 5% growth trend by a significant amount, with small gains to government, health and education services. However, the overall story that the non-resource sector has fallen below its growth potential by 2016 remains the same.
The analysis has also used 2008 as the base year, rather than using the average of the years 2007 to 2009 for simplicity. All values are in 2013 constant prices rather than 2016 prices so that it is easier to compare with the PNG Treasury figures (Table 1 Appendix 3 of the 2018 Budget Volume 1 is all in 2013 prices). The latter changes have no impacts on the earlier results.

