All posts by pngeco5_wp

PNG’s biased election – O’Neill and Gamato’s shame

PNG’s election has unquestionably been biased in favour of the O’Neill government. The army of 300,000 PNC ghost voters, over 6,000 for every PNC electorate on average,  is almost a statistical certainty – a level of gross manipulation that even surprised me.

My last article indicated some extraordinary differences in the numbers of “ghost voters” (or “excess electors”, or “inflated rolls”) when comparing PNC electorates to non-PNC electorates. These were using simple statistical tools – totals and averages. This article provides more detailed statistical analysis of the likely pattern of bias.

These detailed statistical regressions (done by an independent expert) indicate a higher than 95% probability (so 19 chances in 20 – pretty high odds!) that the election has been biased in favour of the PNC.

That figure is 99% when 5 statistical outliers are removed (so 99 chances in 100 – extraordinary odds).

This is an extraordinary pattern of bias – one rarely found in statistical analysis in the social sciences.

When determining statistical relationships, sometimes “statistical outliers” are identified. Five were identified by the model.  This article includes figures both including and excluding these “outliers” – see summary table below.

The following graph is based on excluding the 5 outliers – so on the remaining 84 electorates. It shows that the O’Neill PNC electorates had on average 6,349 ghost voters. Non-PNC electorates had a negative number of 621 – people would turn up to vote and find their names were not on the roll.  Some of this is accidental or chaotic, but the statistical analysis indicates much of this is most likely deliberate – 99% most likely!

There will be many tricks ahead as the O’Neill government continues to play the advantages of incumbency (such as delayed counting and claims of failed elections in key areas where Morauta and Polye had strong claims).

Gamato needs to take responsibility for this biased election and resign.

The public has a right to know what actually happened to the 2017 electoral roll, the reasons for the chaotic distribution of ballots with inadequate numbers going to key anti-O’Neill areas (such as the universities), the very suspicious pattern of slow counting in potentially key alternative government strongholds, the reasons he has started to hide from the press and why he attacks commentators for simply using the same comparison he used on 9 April or figures he’s earlier distributed.

The Election Advisory Committee should reform and advise the Governor General, notwithstanding the limits on their power, which electorates should be declared failed. Ialibu-Pangia and Tari would seem prime suspects for being declared failed with unacceptable last minute gerrymandering and statistically improbable voter turnout figures.

My next blog will deal with the ludicrous attempt by Gamato to defend his biased practices in his Press Release on Friday.

Fortunately, the public backlash against PNC is so powerful that despite the clear bias in this election, there still remains a historic chance for change.

May the anti-O’Neill forces be able to find enough common ground to form a new government.

Details

Statistical analysis confirms PNC’s army of around 300,000 ghost voters.

Regression analysis for the 89 electorates, with 49 PNC members standing for re-election, indicates a 95% probability that there is a bias in favour of the PNC (see results above and below).

The statistical analysis (by an outside expert) is set out in response to three questions -key figures are the P values – note descriptions of some PNC electorates have been updated since the earlier analysis based on the PNGEC nomination forms by party rather than the PNG Parliamentary website).

In determining relationships, statistical models can indicate “outliers” which are often excluded for the purposes of analysis. This model identifies 5 electorates as “outliers”.  Excluding these, the probability of electoral bias in favour of the PNC climbs to an extraordinary 99%.

In the social sciences, yet alone medical science or other areas, it is extremely rare to get such a powerful relationship. Possibly there is some extraordinary explanation for why there is only 1 chance in a 100 that the 2017 election was not rigged.  Releasing more information to the public at the LLG and Ward levels would allow more detailed analysis and greater certainty.

I had expected the devil to be in the detail – see here – but the manipulation appears to have been so extensive and clear that the bias shows up in even very aggregrated data. This is a shameful situation.

The Electoral Commissioner should take responsibility for this failure of the electoral roll – it was his job to get rid of “ghosts”. If that was too much to hope for, at least he should have had the ghosts evenly spread.


PNG’s Electoral Bias Indicators –PNC’s near 300,000 Ghost Voters and Mathematical Impossibilities

Summary

Statistical indicators suggest the O’Neill government has used its power of incumbency to ‘cook the books’ in its favour. Comparing the 2017 electoral roll with population estimates by electorate based on the 2011 census, the Electoral Commission has created nearly 300,000 “ghost voters” in PNC controlled electorates.  This is 5,682 “ghost voters” for every PNC sitting member. This is over 10 times the number of “ghost voters” for non-PNC sitting members. PNC members are also being declared elected based on “mathematical impossibilities”.

PNG’s vibrant democracy, including its extraordinary diversity and combination of individual choice and clan loyalties, may still be able to overcome such electoral bias in favour of O’Neill. This may depend on the Biblical and moral choices about to be made by new Independent members. May they choose wisely and morally, not just chasing the money politics of the PNC and its likely manipulation of the election, when they decide on PNG’s new government.

PNC’s army of “Ghost voters”

One extraordinary indicator of electoral bias is that O’Neill PNC supported electorates had, on average, an “extra” 5,682 people on the electoral roll relative to their population. The number of these “Ghost voters” is over ten times larger than the average of 507 for non-PNC electorates (details, including methodology, below).

Overall, there were nearly 300,000 more people on the electoral roll in PNC electorates than the latest population census would suggest. This is much greater than the extra 20,000 in non-PNC electorates.

It seems the cleansing of the 2017 electoral roll, assisted by Australia, was able to find nearly all the “ghost” electors in non-government seats, but failed abysmally in seats held by the government.

This is also a very sad comment on the quality of Electoral Commissioner’s management of the election. Combined with his failure to maintain the confidence of the independent Electoral Advisory Committee, he should resign and give power to a more independent body.

This type of electoral bias has provided nearly 300,000 extra votes available to government electorates.

But what does this mean in practical terms?

At the margin, this type of electoral bias made it more likely that your name would be on the roll if you turned up in an electorate controlled by the government. Many PNG citizens were disenfranchised by not having their name on the roll. For non-PNC electorates, if we exclude the statistical outlier of the electorate of Obura-Wonenara (which had a very , very unlikely figure of the census being only one-quarter of the electoral roll – nearly double the outlier of any other electorate), all other non-PNC electorates had on average 864 less names on the electoral roll than suggested by the latest census.

And the extensively reported “double voting” is easier to do when there are more names on the roll.  And easier to sneak in a few extra pre-filled ballot boxes with your preferred candidate.

But the key issue here is how these “extra votes” are actually distributed at the sub-electorate level – so by LLG, Ward and even by polling station.  The story of the Simbu election scrutineers (see here ) indicates the type of manipulations that are easier to do in electorates where the PNC members have many more “ghost voters”. As argued here, the devil is generally in the detail (apart from apparently crude stuff-ups such as the Marape vote – see below).

We know that due to clan loyalty, and views of leadership, some seats will comfortably go to particular people and parties – O’Neill, Basil etc. Marape’s re-election was expected, so it is hard to figure out why there would be manipulation (unless it was targeted as an early count, early declared victory to give a head-start to the vital government coalition formation process).

In the 89 open electorates (so not the 22 electorates based on electing a Governor for the Province who then sits in the 111 member Parliament), the average first preference vote was 8,500 – only 20% of all votes cast. If you had the most first preference votes, you then generally won the election– three-quarters of all elected members won their first preference count (see here).

So by adding even an extra thousand or two thousand possible votes in areas where candidates had particularly strong support, you could gain an extra few percent which can be vital for overall success.  An average of 5,682 “ghost voters” provides enormous flexibility to manipulate the election.

Of course, there is an extraordinary amount of diversity and noise in the election. This type of game will not necessarily overcome other issues which possibly reduce popularity. They do not account for major election promises that are particularly beneficial to certain electorates (such as the Prime Minister’s K3.5 billion give away of a substantial share of its ownership of the PNG LNG project to landowners in Hela and other areas around the project – why wouldn’t you vote for the PNC with this massive handout even if it destroys your budget credibility and issues of equity across all of PNG?). There are many things that cannot be tested by some form of mathematical analysis to determine systematic bias – the courts can go into much more detail, such as whether voters are allowed to vote on Sundays and forms of intimidation in certain areas.

There are even more rigorous statistical tools available to inform an understanding of the electoral bias already very evident in this election. This would require more detailed information, as there is even more devil in the detail. It is a shame that the Electoral Commission is hiding more detailed information that would inform good public policy.  It is understandable that the Electoral Advisory Committee resigned as it wasn’t getting this type of detailed information.  However, possibly there is enough public information to inform their advice that there is a systemic bias towards the O’Neill PNC, and that some electorates have “mathematically impossible” outcomes.

Mathematical Impossibilities

Some “mathematical impossibility” bias indicators are crude but damning.

  • For example, there has been no explanation provided for how the first “elected” member – the Hon. James Marape Minister for Finance – won in an electorate where there were between 7,000 and 20,000 more votes cast than there were names on the electoral roll, or shown in the latest population census.
  • The “gerrymander” to shift 13 Wards this electorate accounts for possibly 9 to 12 thousand of the difference, but there still remains a huge gap of over 7,000 extra votes.
  • This is the type of bias it would have been good for the Electoral Advisory Committee to examine, and if there remained major issues of “mathematical impossibility”, recommended that the election in that electorate should be re-run.
  • As a general rule, unless some clear explanation can be provided, an election should be re-run if the number of votes cast exceed the number of people on the electoral roll or based on the latest census.

Next Steps

As the election count continues, a key third stage of the four stage election process (see EAC comments) there is still a great need for integrity from officials, scrutineers and police. There are still key decisions ahead for the Electoral Commissioner and even the Governor General. These decisions would be better informed if there was greater information sharing – this could help confirm the legitimacy of the election.  Looking ahead, such analysis can also provide some benchmarks for hopefully making the 2022 election a much better and fairer election for whatever government emerges from this election.

There is also a key stage for government coalition formation.  As expected, no party will win an absolute majority. There is a clear coalition of parties that are anti-O’Neill, including former coalition partner National Alliance headed by the former Treasurer (who was sacked in part for exposing other budgetary games played by the O’Neill government on the debt to GDP ratio and economic growth – the type of games indicating a willingness for the O’Neill government to play games with the electoral numbers).

These independent members will have a key role in shaping PNG’s future. Hopefully, they will reflect on the legitimacy of many PNC members who have been given an unfair head-start. Early choices by the “Independent” member for Koroba/ Lake Kopiago, Hon. Petrus Nane Thomas to immediately join PNC without time for considering alternatives is a disappointing start. May other Independent candidates be guided by the Bible and their moral vision to decide whether such deliberate bias should be rewarded with the right to rule.

Detail

The analysis for this blog is based on the distributed version of the 2017 electoral roll, the 2011 Population Census (updated by 16.5% for population increases since then – 5 years at a compounding annual growth rate of 3.1%), the ANU Electoral Database and information on who were actually PNC endorsed sitting members of parliament (this was based on the PNG Parliament website, except for 4 members whose party endorsement differed from the Parliamentary website eg Potape who was PNC in the parliament but not endorsed as the PNC candidate).

The excel tables providing all this information at the electorate level is available by emailing admin@pngeconomics.org. A summary of the totals and averages are set out in the following table –

This analysis has taken some time to put together.  Over coming days, I will apply more detailed statistical tests to examine patters of electoral bias based on publicly available information.  This analysis would be greatly assisted by more detailed information – the type of information that should be publicly available such as the number of actual ballot papers distributed by polling station.  This is the type of information that was not even provided to the PNG Constitutional Electoral Advisory Committee.  Unfortunately, I suspect that public policy analysis on the true level of possible fraud in this election will be buried by government authorities refusing to provide detailed information.


PNG’s failing election – the devil is in the hidden detail

Summary

The resignation of PNG’s Election Advisory Committee is a devastating blow to the credibility of PNG’s 2017 election.

The failure to provide this high level constitutional Committee with factual electoral information suggests deliberate acts to hide the truth (the EAC is a constitutional committee with the Chief Ombudsman, representative of Transparency International, and  a law lecturer from the University of PNG).

In its resignation letter, the committee indicates it was “prevented from performing its constitutional duties and roles” because it has not been provided with “baseline data and information nor have we been party to regular reporting”.

Detailed information is required to unpack possible deliberate ‘cooking the books’ from the general chaos and mismanagement of PNG’s 2017 election.

At an aggregate level, initial statistical analysis indicates that no clear pattern of bias can be determined at an electorate by electorate level (see below).

However, the devil is in the detail. The analysis needs to be done at the Ward or even polling station level to determine if there is systematic bias. And this type of information appears to be hidden from the Electoral Assistance Commission and the people of PNG more broadly.

Without such information, it is difficult to understand how the international observers to the election can form a view on whether it has been a free and fair election.

Denying even a thousand votes to even one area by failing to distribute enough ballot papers or omitting a substantial number of previous electors from the electoral roll, yet alone organising to stack a ballot box or steal one, can easily swing the outcome. And it is this type of information which has been denied to the Electoral Assistance Commission.

Australia must take some responsibility for this mess. Protecting a democracy so close to our shores (PNG is less than 10km from Australia) should have been a much higher priority than supporting the planned APEC meeting in 2018, yet alone the funding provided to the Manus asylum seeker centre.

The next steps in this saga are very uncertain. Six electorates were considered “failed” in the 2002 election, but over one hundred electorates were considered fair and a new government was formed.  Concerns appear much more widespread in this election although it has been more peaceful than some earlier ones.  The resignation of the EAC removes yet another important check on the fairness of the election. ‘Following careful deliberation the members of the Electoral Advisory Commission wish to advise that it is unable to undertake one of its primary functions and which is to “consider and recommend failure of an election”’.

Maybe it is not too late to save this election. Actions by returning officers, scrutineers, police and Electoral Commission officers can still have important impacts in helping protect the remaining integrity of this poll. The Electoral Commissioner should resign. The influential role of recommending the outcome of the writs to the Governor General should be moved to someone seen as more independent of the O’Neill government and the mismanagement of the election. Possibly the independent EAC itself should be asked to perform these key high level roles with the administrative functions going to the deputy EC. Alternatives such as a year of chaos preparing for yet another election or actions by the armed forces are not at all appealing.

Details

The Electoral Assistance Commission resigned last night (9 July) covered on EMTV and with a public press release.

The three-member Election Advisory Committee who are appointed by the Governor General comprise of the Chief Ombudsman Commissioner (or his nominee) and two other persons – a nominee by the board of Transparency International (PNG) Incorporated and a retired judge or lawyer qualified to be appointed a judge nominated by PNGEC after consultations with the Chief Ombudsman and TIPNG.  Details of the EAC’s role are covered in this report here.

Functions of the Election Advisory Committee were activated from the issue of writs on April 20, 2017 and will end upon the return of writs on July 24, 2017.

Electorate by electorate information is available for 2017, 2012 and the 2011 population census.  Early statistical information at the electorate level indicates that on average, the ratio between the number of votes cast in the 2012 election (3.6 million in total), and the number of names on the 2017 electoral roll (just over 5 million in total) was 1.38.  Similarly, the ratio between the numbers of people in a particular electorate in the 2011 population census (3.9 million), and the number of people on the 2017 electoral roll, was on average 1.23.  With a 3.1% annual population growth rate, the expectation was this ratio would be slightly lower at around 1.17.  However, for both these unweighted ratios, there was no clear difference between PNC electorates and non-PNC electorates.

There was great variation between individual electorates, however, and this may go to issues of broader fairness. For example, the size of electorates can differ by a factor of over 8 times between the largest and smallest.  The 2011 Census says there are 133,452 people over the age of 17 in Angalimp-South Wahgh in Jiwaka Province (although only 125,502 names on the 2017 electoral roll) while there are only 16,309 people over the age of 17 in Goilala in Central Province (although with 29,176 people on the electoral roll).

Looking at the 2012 election results, there were many close races where only a few hundred votes would have made a difference.  If the ruling People’s National Congress party (PNC) of Prime Minister O’Neill was deliberately aiming to bias the election (amongst all the noise), one would target key marginal electorates.  Targeted actions, such as not providing enough ballot papers to even one key ward where the main opponent’s support was located – or a key university – could easily swing the outcome for the election.  Examples of such “marginal” electorates include the following: PNC close wins – Port Moresby North West by 17 votes after preferences, South Fly by 31 votes after preferences (and lost on 1st preferences by over 400 to THE), Nawae by 433, Madang Open by 544 (disturbing reports of police shooting scrutineers there on Sunday 9 July), Okapa Open by 645, Kairuku Hiri Open by 1,162 and Kokopo by 1,201.  Other examples where the ruling PNC lost a close electorate include the following: Gazelle Open – PNC won the 1st preference tally by 77 votes but lost after distribution of preferences by 113; Gumine Open – PNC lost after distribution of preferences by 536 – in Manus, PNC won the first ballot but lost by 257 (Manus Provincial also close, as was Milne Bay Provincial).

There has been a discussion on the meaning of a failed election, and the possible determinates – see here as well as the comment on the broader interpretation provided by the Supreme Court in failing the Local Level Government elections in 2013.

No specific figures have been provided on the level of Australian support for this election. Reports are the figure is around one-half the level provided in 2012 (this needs confirmation). Certainly, the figure is much less than the expected support for the 2018 APEC meeting which is expected to exceed $A100 million -see here. It is difficult to explain this choice of priorities in supporting democracy in our closest neighbour, especially given concerns about growing Chinese influence.  Of course final responsibility for the election and how it is conducted rests with the sovereign country PNG.  As a close partner, with historic responsibilities and key national interests, we should have done better.

PNG’s fiendish fiscal figures – a historical perspective

Summary

Using PNG’s updated GDP numbers, there are new insights into PNG’s economic history. In particular, they show how bad the last four years have been:

  • PNG’s budget deficits over the last four years are the worst in PNG’s history.
  • From 2012 to 2016, deficits have totaled an extraordinary 23.8% of GDP
    • This is nearly three times higher than the next worst five-year period for spiraling deficits (8.7% from 1992 to 1996 with five-year periods based on parliamentary terms).

  • These daunting deficit figures are the driver behind the explosion in public debt from 17.3% of GDP in 2011 to 35.5% in 2016.
    • In the 1992 to 1996 period, debt started at much higher levels (28% of GDP) but still didn’t reach 2016 levels (34.4% in 1996 vs the current 35.5% level using 2016 FBO numbers and IMF figures on 2016 GDP).
  • There are two drivers for these historically high budget deficits.
    • First, the massive increase in expenditure in 2012 was the largest in PNG’s history – and there was another substantial increase in 2013.  Since 2015, the government has embarked on the most severe expenditure cuts in PNG’s history (earlier articles indicate that key areas such as health, education and infrastructure are being particularly cut).
    • Second, there has been a collapse in revenues back to 1995 levels.  Almost all of this reduction reflects the fall in growth in the economy probably resulting from exchange rate shortages and concerns about economic policies in areas such as land, agriculture and SMEs. Revenues are going down even faster than the government expenditure cutting which explains the increased in the deficit level from 2015 to 2016.
  • As PNG is in an election campaign, I will not draw out the conclusions from the above analysis concerning the current government’s record on economic management.

Details

For those that know me, I have a deep interest in PNG’s economic history. A tok pisin version of earlier analysis is available here with the English version available here. A big issue for this analysis has been the dramatic increases in measured GDP (or size of the economy) by the National Statistics Office as well as the massive overstatement of recent economic growth rates by the current government according to the IMF – see here.

With a consistent GDP series now going back to 1980, it is now possible to examine some key economic indicators through time.

An earlier post examined the extraordinary falls of some 30% in average standards of living since 1980 (measured by real non-resource GDP per capita) – see here or in tok pisin here. This post examines some key budget (or fiscal) ratios.

The following graph provides a high level summary of PNG’s fiscal performance from 1980 to 2016.

The green line shows the government expenditure to GDP ratio (source for all expenditure and revenue figures are PNG Treasury Budget documents).  Essentially, it shows how large government spending is relative to the total size of the economy.

Over the last 36 years, there is a general pattern of the government spending more relative to the size of the economy – particularly from 1989 to 2014.

However, despite this increasing ratio, government expenditure has not kept up with population increases and inflation. This is a key factor behind falling service levels (in addition to issues such as weakening institutions, corruption, poor expenditure decisions).

Earlier analysis using the old GDP estimates suggested that PNG had government spending much higher than most other countries in the Asia-Pacific region.  However, with the new figures, the levels of government involvement in the economy are much closer to PNG’s developing neighbours.

One feature of the graph is the large increase in the government expenditure share from 2011 through to 2014. This in part was based on counting the chickens before they were hatched – risky assumptions about the size of revenues from the PNG LNG project.  This historic increase was followed by a historic decrease – a somewhat crazy roller coaster ride.  As discussed elsewhere, the cuts made from 2015 are more severe than those imposed on Greece and they have, contrary to government statements, targeted areas such as health, education and infrastructure.

The revenue and grants line is shown by the brown dotted line.  This line was in slow decline from 1980 through to the mid 1990s before it started growing through to about 2011.  In particular, there was a ‘bump’ on top of this widespread revenue growth from the strong mineral revenues in the mid-2000s.

However, this line has fallen off a cliff in a way never before experienced by PNG.  This reflects a collapse in tax revenues from outside of the resource sector, reflecting a major drop in growth and a likely recession.  Of course the 2015 drought and the fall in commodity prices have had an impact – but these account for less than one-third of the fall in revenues relative to expectations – see here.

The gap between the expenditure line and the revenue line is the size of the government’s budget deficit (if expenditures are greater than revenues) or surplus (if revenues are greater than expenditures).

PNG has usually had a budget deficit – averaging about 1.5% of GDP. This is regarded as moderate for developing countries, and normal economic growth rates (in part based on good investment decisions) would comfortably cover such deficits without concerns about debt levels.

However, over the last five years, PNG has had its four largest deficits as a share of the economy in PNG’s history.  Even the 2012 figure of a 3.2% of GDP deficit is the equal seventh worst in PNG’s history (matches the 1982 deficit) with 1992 and 1993 the in-between bad deficit years.

The top graph  adds five years of government budget balances as a share of GDP.  The 2012 to 2016 combined deficits of 23.6% of GDP are extraordinarily large – nearly three times higher than the next period on 1992 to 1996 (which included a severe economic crisis in 1994 to 1995).

These deficits have to be paid for by someone – and this is driving the doubling of PNG’s debt levels relative to the economy from 2012.  Such a path is clearly not sustainable.

Future analysis with the updated figures will also examine some monetary aggregates and trade ratios. The aim is then to produce a more comprehensive update on PNG’s economic history.


PNG’s Debt Crisis Risk – Sky-rocketing Public Debt Charges

Summary

PNG is facing a serious debt crisis risk.

The threatened debt crisis results from the extra-ordinary increase in Public Debt Charges during the O’Neill government.

In 2016, these public debt charges totaled K13 billion.

In 2012, these charges totaled only K1.5 billion.

Almost all of this extraordinary increase comes from an explosion in repayments of domestic debt.  These repayments have increased by over one thousand per cent from 2012 to 2016.  Every single month, the PNG Treasury, through BPNG, needs to raise nearly K1 billion just to keep debt rolling over.

PNG’s debt crisis risk is this enormous monthly debt rollover burden. If there is a loss of confidence, then the crunch point could come very quickly.

Debt crises are rarely about failure  to repay an interest bill or just because of some very high debt to GDP ratio.  They come when a principal payment cannot be made – when debt cannot be rolled over and there is a debt default. This applies to the private sector or governments. And with a looming debt default, governments usually have to turn to the IMF (the cheap option with conditions), other international financing (expensive with fewer conditions), or start printing money very quickly (high inflationary risks and a slippery slope).

And the O’Neill government has now massively increased the monthly rollover burden and made PNG very vulnerable to a debt crisis.

There are other falling debt indicators under the O’Neill government which are also sounding loud warning bells (figures in table below):

  • The rapid increase in the size of official debt – from K8.5 billion in 2012 to K22 billion in 2016 – a 160% increase – when will this stop?
    • Another 160% increase over the next four years would lift official debt to K57 billion by 2020.
  • Uncertainties about the true size of total public debt as some is being hidden in SOEs or in BPNG’s balance sheets – figures of closer to K40 billion have been used but they cannot be verified because of government secrecy.
  • The rapid increase in debt interest costs – from K0.3 billion in 2012 to K1.3 billion in 2016 – now over one-tenth of the budget – money no longer available for health and education – the third largest area of expenditure which is being hidden by the government during the election campaign – see here.
  • The rapid increase in the size of debt relative to GDP – from 19.8% in 2012 (using NSO’s new GDP number) to 35.5% in 2016 (using IMF GDP number).
  • The rapid increase in the interest repayments to revenue ratios – from 3.6% in 2012 to 12.1% in 2016 – see an excellent article here.

The PM is correct in that PNG’s debt to GDP ratio is not high relative to other countries, but this ignores two critical issues which any true leader would consider:

  • First, the current PNG government is not following its own Fiscal Responsibility Act which limits debt to 30% of GDP.  If the government is not following its own laws, those which aim to provide a “fiscal anchor”, how can the government be trusted on economic management?
  • Second, ratings agencies and others do not look at just one figure – and the combination of the very rapid increases in all debt indicators as shown above  is a real cause of concern.  Little wonder that Moody’s decided to continue with PNG’s 2016 credit rating downgrade to B2 – five levels below “investment grade”.

The above graph showing the explosion in domestic debt repayments is a very worrying development. It reflects a decline in market confidence in the government (with the quantum shift to shorter term maturities). It also reflects PNG’s poor economic management over the last five years on debt, the budget, the exchange rate and sustainable growth policies.

For the sake of their children, electors should listen carefully to these warning bells of sky-rocketing debt crisis risks.

Details

One element of the O’Neill government’s economic mismanagement has been the rapid escalation in debt. This has been driven by the largest budget deficits of any government in PNG’s history.

The latest Treasury budget document (the 2016 FBO) indicated these deficits are growing once again (back to over K3 billion). The 2017 budget played some tricks to try and hide how bad things were – see here with Tok Pisin translation here.  On debt, the 2017 budget forecasts have already been shown to be fraudulent with debt levels at the end of 2016 already exceeding the expected outcome for 2017 – see here.

One key element of debt mismanagement has not received much comment. This is the extraordinary increase in overall public debt charges.

There is some confusion about these public debt charges, especially principal repayments.

Debt principal repayments are a cash flow out of the annual Parliamentary budget appropriations and must be paid for.  These debt repayments are supposed to be included in the annual budget appropriation bills. However, the government forgot to do this in 2016 – a breach of the constitution which undermines Parliamentary democracy – see here and here . Fortunately, the government did include these repayments in the 2017 Appropriation Bills.

But there remains confusion – see here for an excellent explanation by an aspiring woman leader – Ms Kessy B. Sawang.  Although debt repayments are included in the formal budget appropriation bills that should be passed by Parliament, they are not included in the annual budget.

For example, the 2017 budget totals K13.3 billion.  The PNG Parliament’s appropriation bills for 2017 total K20.4 billion.

Such treatment is appropriate and aligns with international standards.  Debt interest payments are an annual charge on loans and represent budget expenditure. Debt principal repayments are a financing item.

However, in addition to the rapid increase in public debt levels, PNG’s debt financing has moved dramatically towards very short-term debt maturities. Outstanding short-term Treasury Bills are now greater longer-term Treasury Bonds of (K8.7 billion vs K7.8 billion in the 2016 FBO).  But even this does not show the dramatic move to even shorter loan terms in Treasury Bills. These are now often issued for only 3 months – requiring them to be paid out and re-borrowed several times every year.

Treasury acknowledges this shift by noting the “increase in the frequency of refinancing or roll-over of Treasury Bills whose maturities are six months or less throughout 2016.” (2016 FBO page 16).  Indeed, in the 2017 budget, the Treasury described there being a “quantum shift by the major investors away from
longer tenors of 182 days and 364 days to shorter tenors of 28, 63 and 91 days” (page 53).

To make “space” for these shorter term loans, the central bank has had to reduce its own monetary policy controls through the issuance of Central Bank Bills. There was the expectation that the level of short-term Treasury Bills would reduce later in 2016.  However, BPNG’s most recent Monthly Economic Bulletin, when explaining the major expansion in PNG’s monetary base of nearly 20 per cent over the last year, states “This was mainly due to significant retirement of CBBs by the Central Bank in December 2016”.  There was no monetary policy justification for such a change. The central bank is getting out of short-term debt for monetary policy management to allow the PNG government to finance its budget deficits and growing debt rollover requirements.

And this move towards shorter-term debt has put PNG on a dangerous treadmill.  Debt  is having to be rolled over much more often.  Most of the K1 billion required in financing every month is just to rollover existing debt – needing to borrow again just to pay off last month’s borrowing. In itself, this is a reflection of declining confidence in the government.

And if this confidence declines enough, and even one bank or superannuation fund decides they would rather keep the cash rather than take the risk in lending money to the government again, then a financing cash crisis can occur with surprising speed.

The experience of debt crises in the past is that there can be warning signs, but when they happen, they can happen very quickly.

PNG electors need to listen to the warning bells.


PM plays politics with budget numbers – hiding debt interest costs

Summary

Prime Minister O’Neill has undermined his own calls for honesty in the election when describing the national budget (see Post Courier Top Stories 16 June 2017 here as well as on his own press site here).

In describing the K13 billion national budget to an election crowd in Popondetta, he appears to have deliberately covered up the third largest item of government expenditure – escalating debt interest payments.

These debt interest payments of K1.5 billion now account for over one-tenth of the entire budget.

This is hidden through the Prime Minister overstating education expenditure by K0.5 billion, health expenditure by K0.5 billion, and “public service machinery” by K0.5 billion (see table below).

Comparing the 2013 budget to the 2017 budget (both K13 billion in nominal terms), the biggest change is that debt interest costs have gone up by K1 billion, and transport funding has been slashed from K2 billion down to K1 billion.

Free healthcare was only ever provided 3% of the health budget (K20m) – no where near enough to cover the real costs of free health. And even this has been cut by 20% in real terms since its announcement.

And Tuition Fee Free education support has been cut in real terms by 30% between 2013 and 2017.

As the Prime Minister says, the people should “not be fooled by desperate candidates misleading them with sweet talk”.

Details of sweet talk

The Post Courier on Friday 16 June had a top story titled “Election Not A Time to Play Politics: O’Neill”.  The Prime Minister’s own website had an even stronger headline of “PM O’Neill highlights transparency in national budget allocation – warns people not to be mislead by ‘sweet talk’ and lies”.

It covered comments made by the Prime Minister during an election rally in Popondetta. Indeed, the Post Courier article is almost an exact quote of the Prime Minister’s press release.

Both sources indicate the Prime Minister stated “the budget allocation is very straight forward and people need to understand the facts”.

He then outlined the break-up of the K13 billion budget into broad expenditure categories, rounding to the nearest K0.5 billion.

However, when comparing the Prime Minister’s figures to those contained in the 2017 Budget papers, there are some significant differences.

The largest of these is that no mention is made of debt interest costs which total an estimated K1,382.9m in the 2017 budget.  This debt interest cost figure is an underestimate as the 2016 Final Budget Outcome confirms that the level of government debt at the end of 2016 (K21,944m) is already greater than the government assumed the debt level would be at the end of 2017 (K21,623m).

Even with the understatement of debt interest costs in 2017, it still is the third largest category of government expenditure.

The following table is constructed from the 2017 budget documents.  The key table is titled “2017 Expenditure by Sector” – see here for document and go to page 39 Table 13).

When using the Prime Minister’s categories of expenditures, the detailed figures are provided in the table below.  These detailed figures are then rounded to the nearest K0.5 billion in the same way as done by the Prime Minister. These are then compared to what The Prime Minister claimed.  The differences, mainly hiding the K1.5 billion in debt interest costs by overstating other expenditure, are shown in the column headed “Sweet talk”.

Some details on the methodology at the end of the post.  A copy of the full spreadsheet showing all the links to relevant parts of the budget can be obtained by emailing admin@pngeconomics.org.

Comparison with 2013 budget

It is interesting to compare the broad structure of the 2017 budget using the expenditure categories of the Prime Minister with those of the 2013 budget.  The K13 billion 2013 budget was of a very similar size to the 2017 budget in nominal terms (so before accounting for the impact of inflation). It was also the first budget released after the Prime Minister was elected in mid-2012.  The budget included the new Alotau priorities of a dramatic increase in funding to districts, provinces and LLGs as well as the introduction of the free health care platform.

When comparing the 2013 to the 2017 budget in nominal terms, the key difference is the massive increase in debt interest costs (up from K0.5 billion to K1.5 billion). These are fully covered by the massive fall in transport expenditure (from K2 billion to K1 billion).  Other items of expenditure stay at the same levels if rounded to the nearest K0.5 billion.

However, if this is put into real terms or 2013 prices (to allow for the fact that inflation between 2013 and 2017 means that every 100 toea now is equivalent to only 80 toea in 2013 terms), then the 2017 budget shows major real cuts of over one-fifth (or 20 per cent) in almost all areas of expenditure. There are two big exceptions to this general pattern of cuts. The first is the major increase in debt service costs of 63% in real terms – so nearly two-thirds greater. The second exception is the massive real cut in transport expenditure of 59%. No wonder the highlands highway is suffering!

Free health

The Prime Minister’s statement talked of “K2 billion on delivering free healthcare”.

However, the budget documents indicate that the free healthcare policy was only ever allocated K20 million (see Table 18 p51 of the 2013 budget with the line “Free Primary Health Care K20.0m). The 2017 budget also makes clear the free healthcare policy is only allocated K20m – page 44 of Vol 1 of the 2017 budget states: “The Capital component of K351.6 million includes K20.0 million fixed support for the Free Primary Health Care Service policy.”  This is only around 3% of the total health budget. This was never enough to really implement free healthcare. And even then, by holding it at the same Kina level, its actual value has fallen by 20 per cent in line with inflation.

Massive cuts have been made to the health budget in real terms (15% from the 2013 budget, and 30% from the 2015 budget), while only this small slice of K20 million has been protected.

Tuition fee free education

Funding for tuition fee free education did receive a serious increase in budget funding by the O’Neill government.

However, comparing the two budgets, the support for tuition free education has been cut from K682m in 2013 to K602m in 2017.

In real terms, support for free education has been cut by 30 per cent.

And of course, most of these funds no longer flow to schools directly as they did in the first year of payments.

Detailed methodology

The Prime Minister uses some different sector categories than those used in Table 13 of Volume 1 of the 2017 budget.  The large expenditure on Provinces also needs to be broken up between education (mainly teachers salaries paid to provinces), health (including the functional health grant), the PSIP/DSIP/LLG funding which the PM separately identifies, tax transfers to the provinces through the GST and Bookmakers Tax of K463m – which is not included in the total as it is not broken up by sector – and other functional grants. There is also a need to separate police, courts and judiciary expenditure out from the more usual “law and justice description”.  All sectors other than those specifically mentioned by the Prime Minister are aggregated into the category “public service machinery”, including the residual from the “law and justice” sector not included in the sub-category of police, courts and judiciary – these items are mainly the defence force costs and Attorney Generals.

Deficit and Debt blow-outs confirmed

Executive Summary

The Final Budget Outcome provides surprisingly frank numbers on the O’Neill government’s inexcusably poor management of government revenues, expenditures and debt.

This document confirms a budget deficit and debt blow-out during 2016. PNG has never before -even during much worse falls in commodity prices – had such an appalling string of huge budget deficits.

The government has no credible path out of the budget mess. Deficit levels are getting larger, not smaller.

PNG Treasury states the debt to GDP ratio is 32.6% and so exceeds the 30% limit set out in the Fiscal Responsibility Act (and using the GDP series when this benchmark was created, it is now 42.7% of GDP).

As a result of the failure to manage this fiscal crisis, PNG’s debt in 2016 is 258% of its 2012 levels. This will be a painful legacy for  PNG’s future as little of the debt blow-out has been properly invested.

The 2016 Supplementary Budget assumed that revenues would increase by K928 million but the FBO indicates revenue actually fell by K1,236.7 million – a difference of K2,164.7 million.

The Supplementary Budget also assumed that expenditures would be cut by K928 million but they were only cut by  K262.2m. Staffing costs actually exceeded the Supplementary Budget by an extraordinary K471.0 million (mainly due to poor planning around teachers). There is a risk that some of the K1,102.7 million reduction in goods and services expenditure late in 2016 is simply a deferral of bills.

The blow-out in deficits and debt results from excessive expenditure expansion in 2013 combined with a dramatic collapse in revenues to the lowest levels since Independence. The revenue collapse mainly results from the poor performance of the PNG economy and the diversion of revenues to Kumul Petroleum – less than 30% of the revenue fall is due to the fall in commodity prices.

The poor budget outcome in 2016 also means revenues will be lower and expenditures higher than shown in the 2017 budget. The 2017 budget needs to be redone.

Details

The PNG Treasury released the 2016 Final Budget Outcome report on 31 March 2017. It is available on its website through the following link. Overall, the report is a credit to the professionalism of the staff of PNG’s Treasury.

This PNG Treasury report confirms what the Treasurer said on the same day when “spilling the beans” on economic mismanagement in PNG – see a link to his presentation here.

Possibly for political reasons, the Treasurer has agreed to release some rather damning numbers that I did not think would come out before the election. The frankness of the FBO reveals a split between the Treasurer’s National Alliance and the Prime Ministers’ Peoples National Congress. Even then, I expected the PM’s minders to catch these embarrassing numbers.

Using GDP numbers based on older PNG Treasury projections or IMF projections, the deficit and debt blow-outs are even worse.

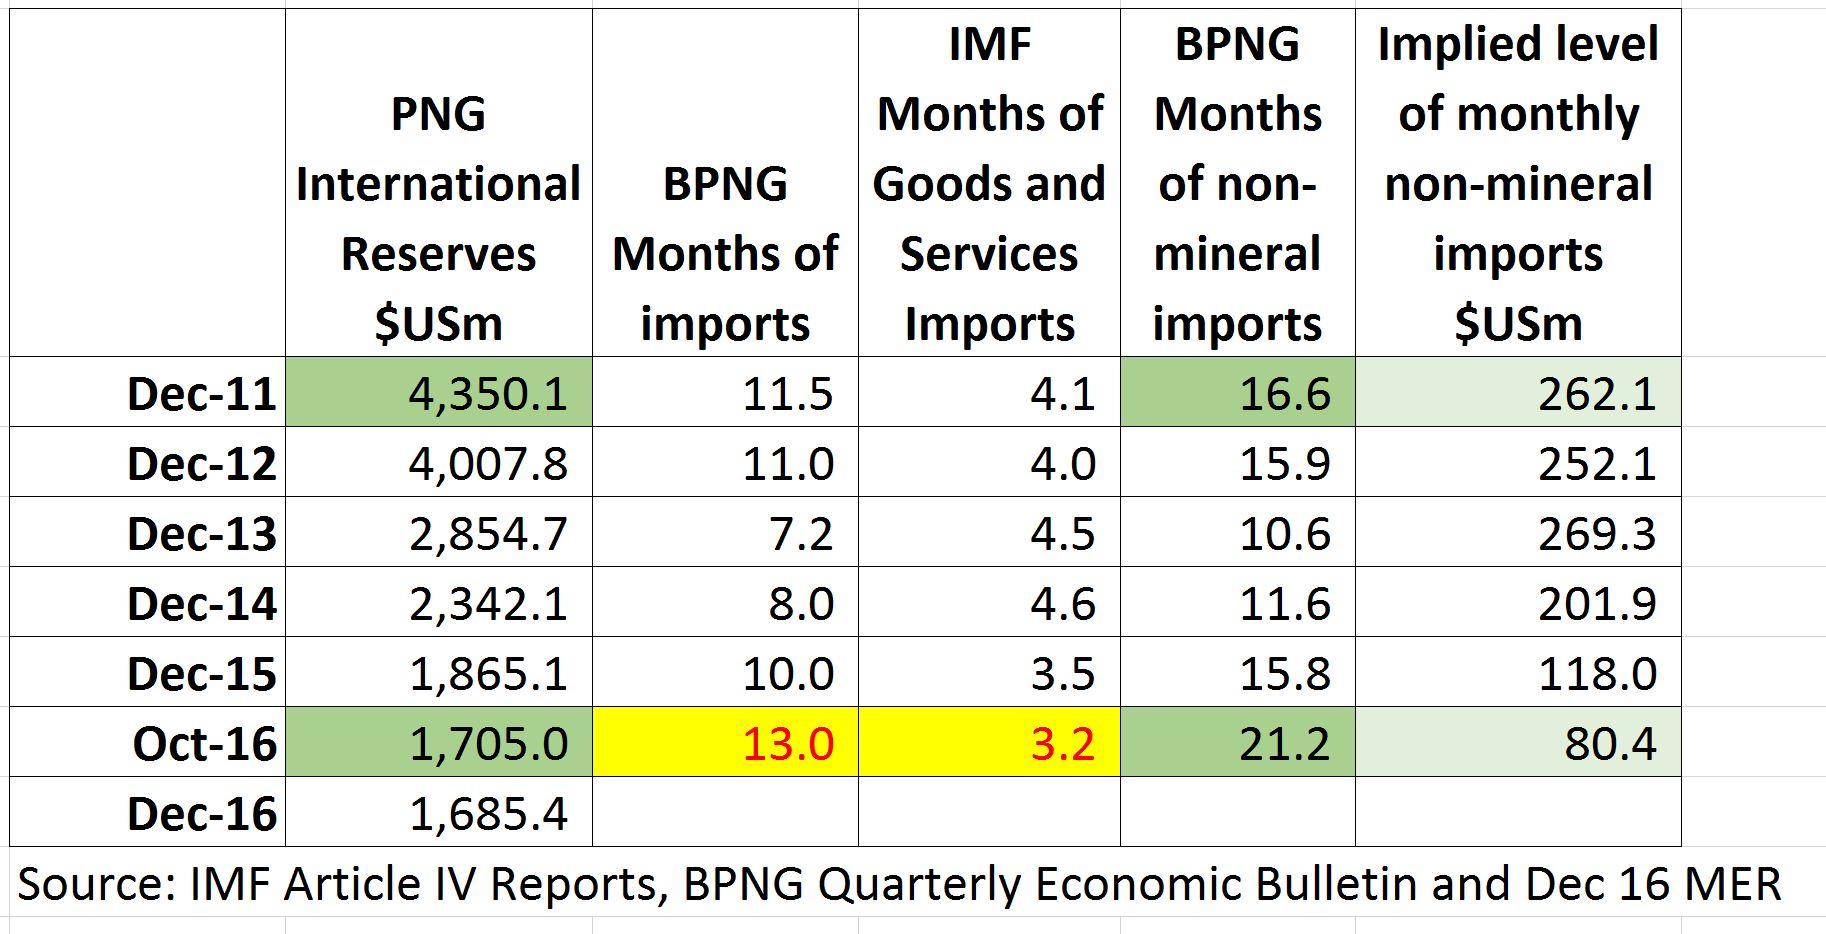
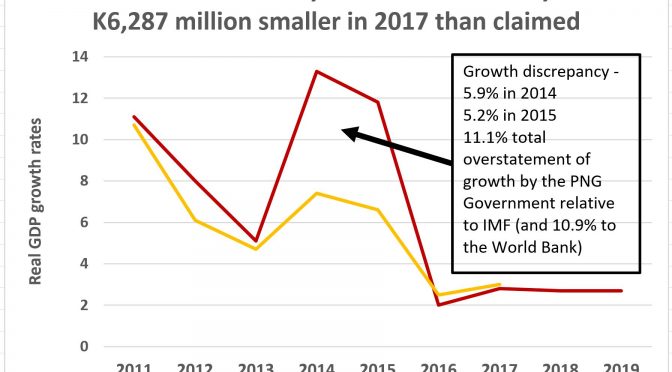
The deficit has increased from K524m in 2012 to K3,086.9 million in 2016. The FBO reports this is 4.6% of “new” GDP but the IMF indicates the “new” GDP numbers are significantly overstated (a report that still has not received any factual coverage in the PNG media on issues such as the PNG government exaggerating economic growth rates by 11.9 percentage points – see here).

To allow historic comparisons, and for consistency, most of this blog will be based on the “old” GDP series (one that was still used in many parts of the 2017 Budget including its key GDP table) . In terms of  these “old” GDP figures, the deficit has increased from 1.6% in 2012 to 6.0% in 2016.

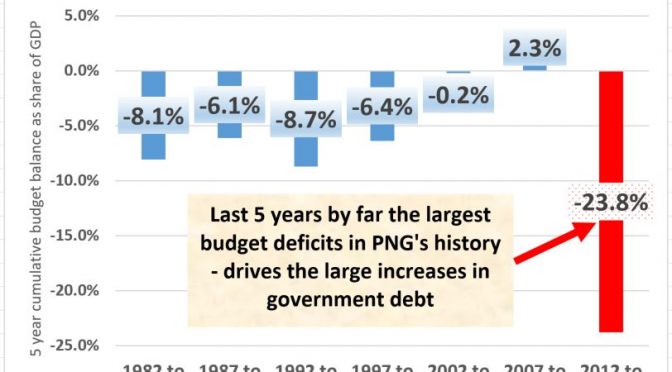
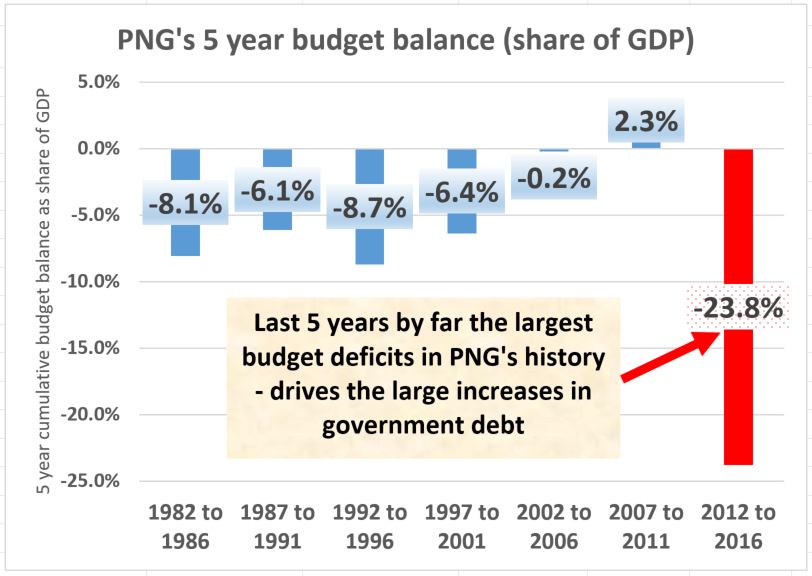
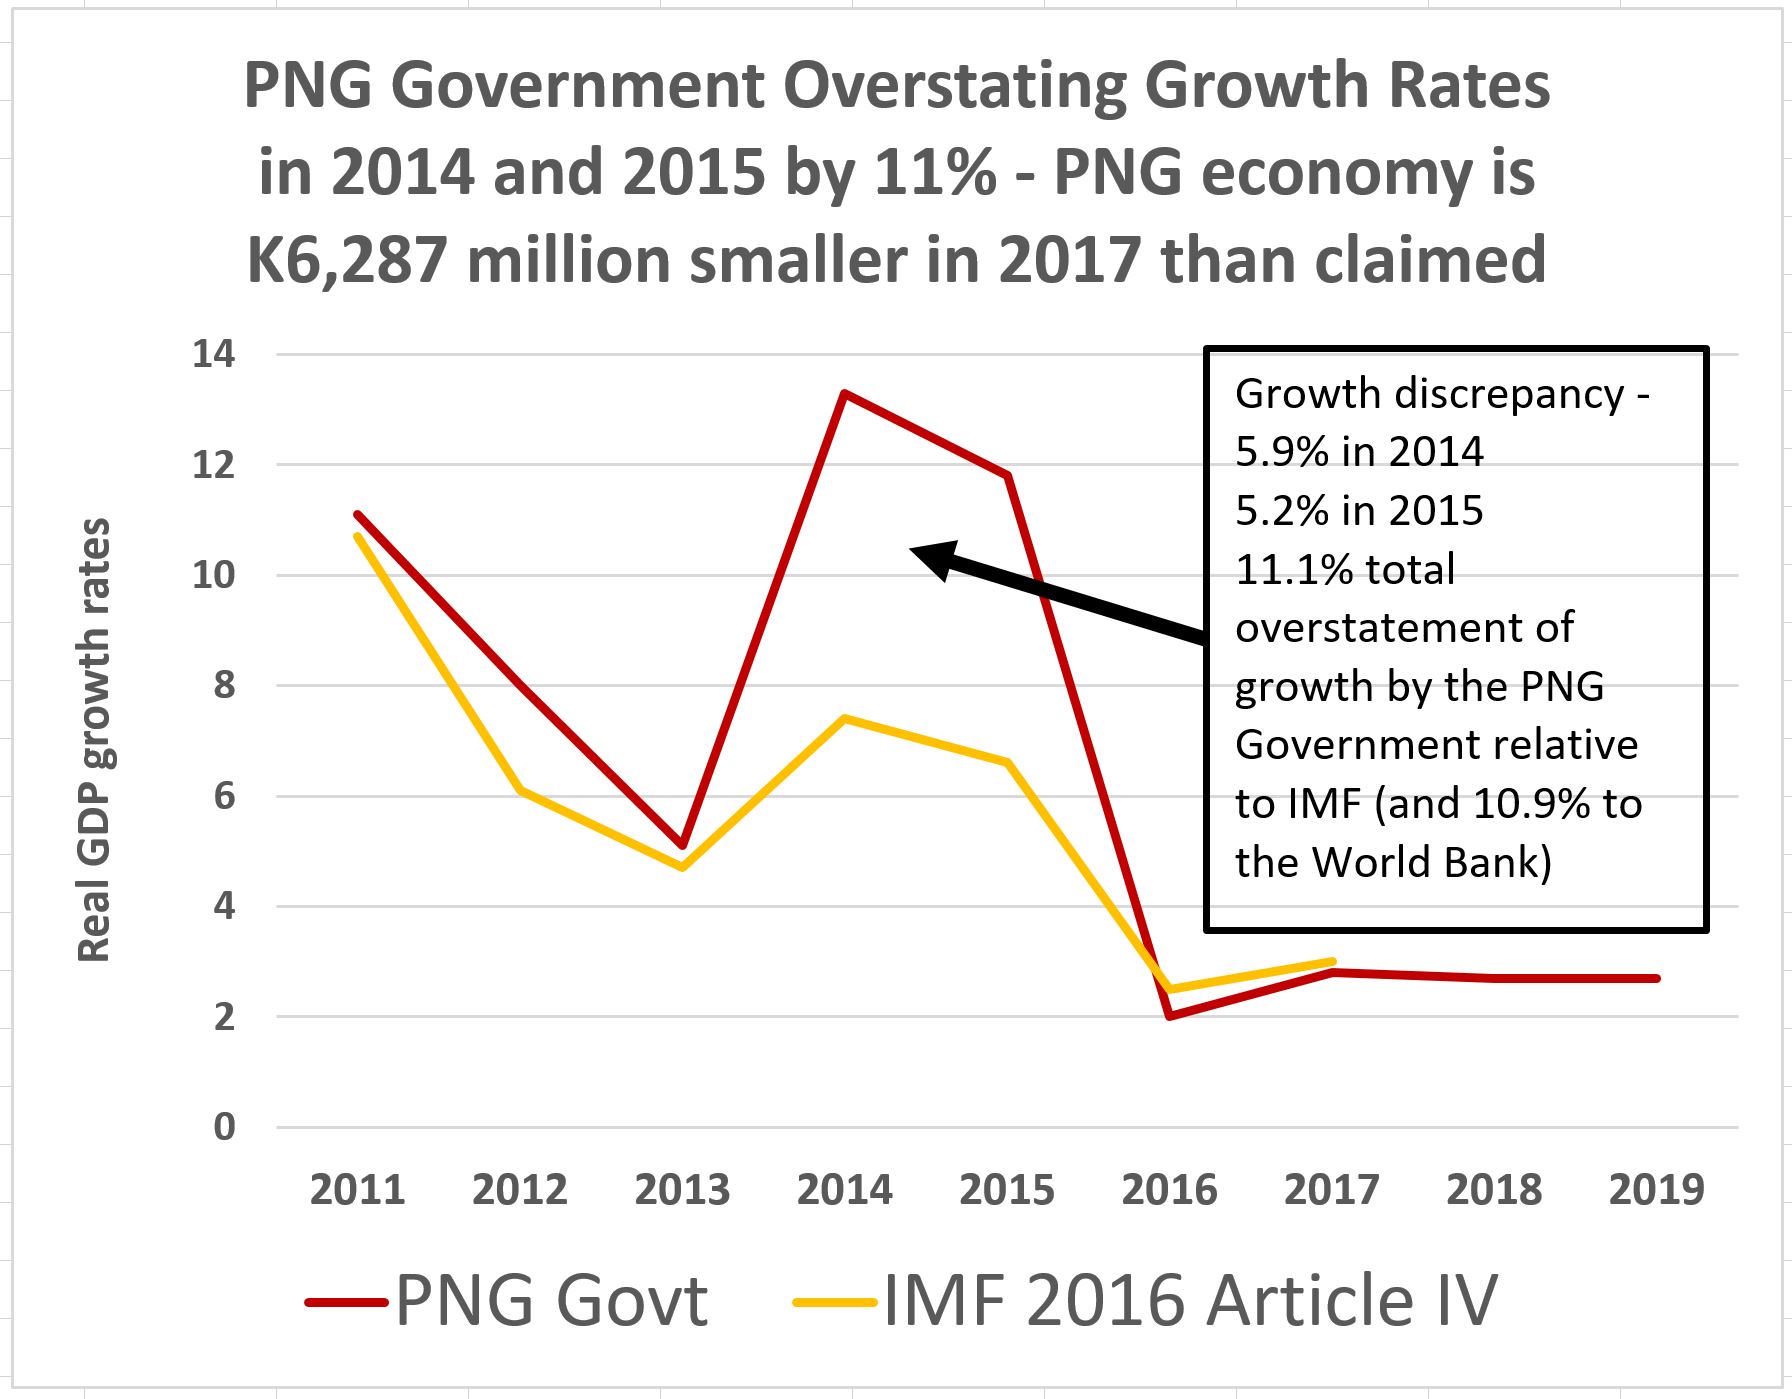
The following graph shows PNG’s budget deficits since independence. The average deficit figure has been 2% – so the 2016 budget outcome is three times greater than usual. Since 2012, PNG has moved to the most sustained and serious pattern of deficits since Independence. With the deficit increasing again, the path to fiscal recovery is very unclear.

PNG deficits 41 years

(Source: Budget documents for deficit figure.  Use of old GDP series to allow for historic comparisons as the “new” series is both overstated according to the IMF and only has been backdated to 2006).

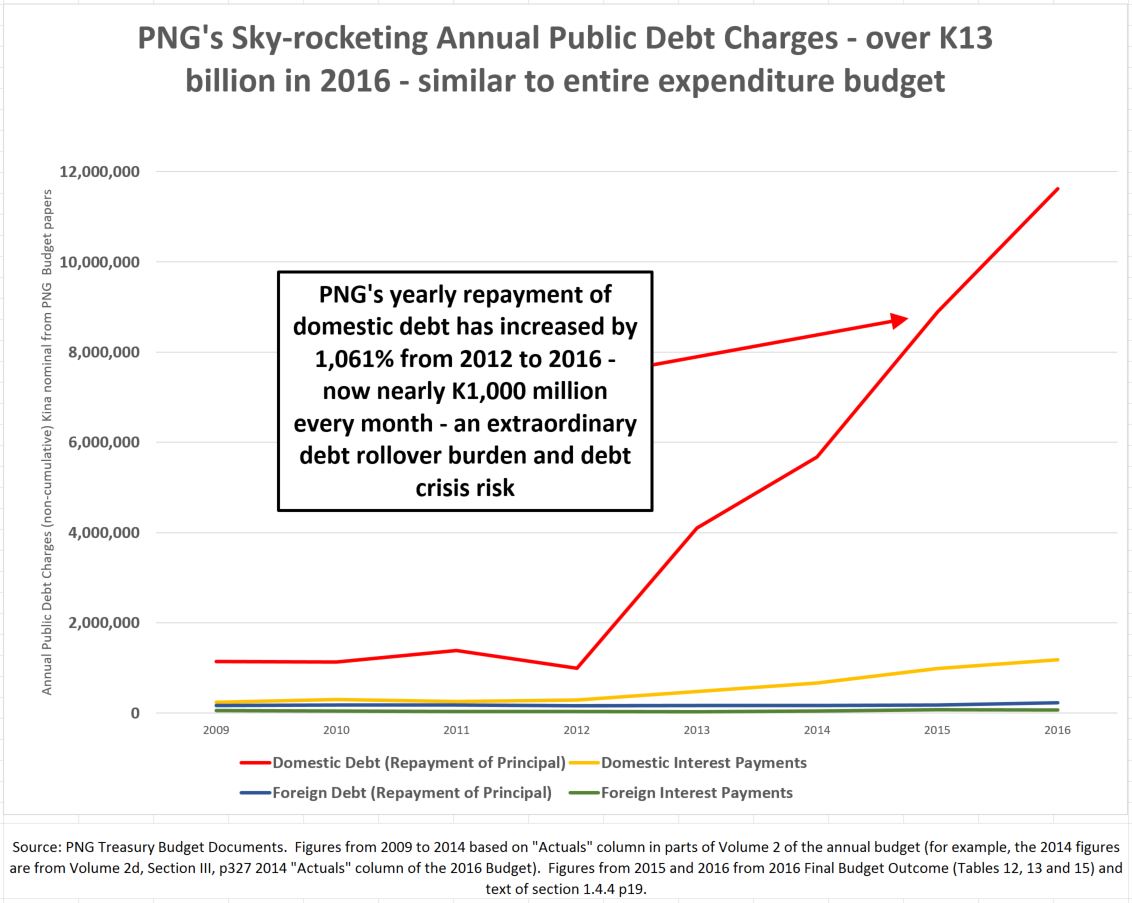
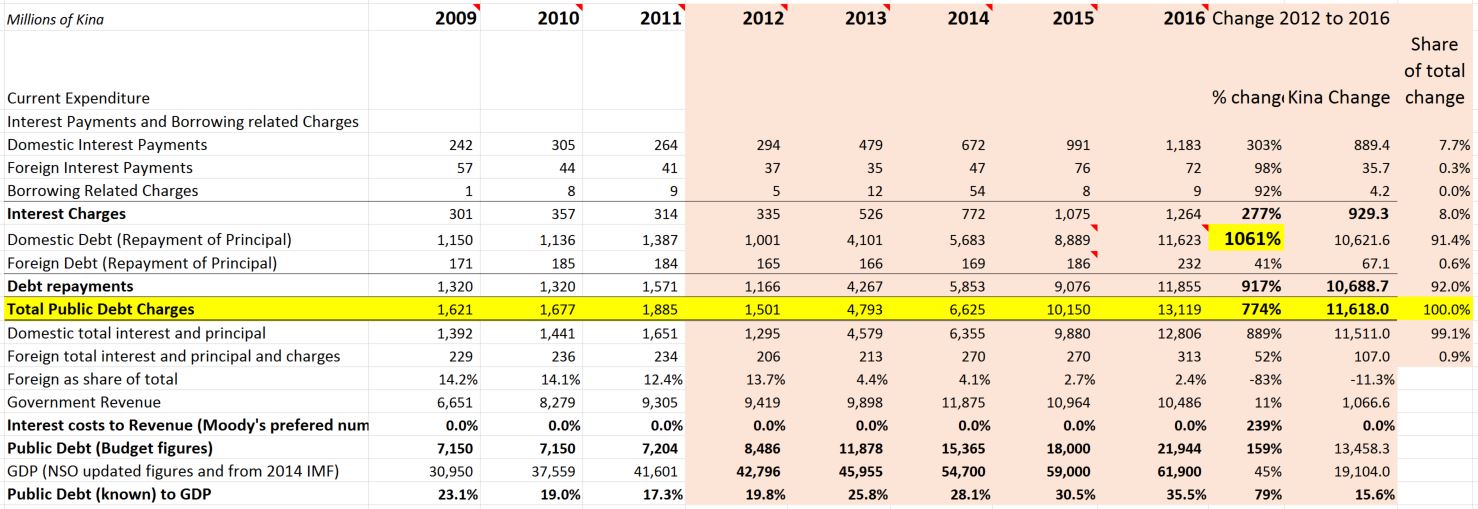
This pattern of large deficits has led to a blow-out in debt. PNG public debt levels (so ignoring off-budget debt held in SOEs such as the UBS loan for Oil Search shares) has increased from K8, 486m in 2012 to K21,944m in 2016.  As a share of GDP, it has increased from 26.9% to 42.7% (using the ‘old’ Treasury GDP numbers for consistency – using IMF figures, the number is 35.5%).

PNG has already exceeded the public debt level expected at the end of 2017.

PNG’s public debt is now 258% of its 2012 level. This will be a painful legacy for PNG’s future as little of the debt blow-out has been properly invested.

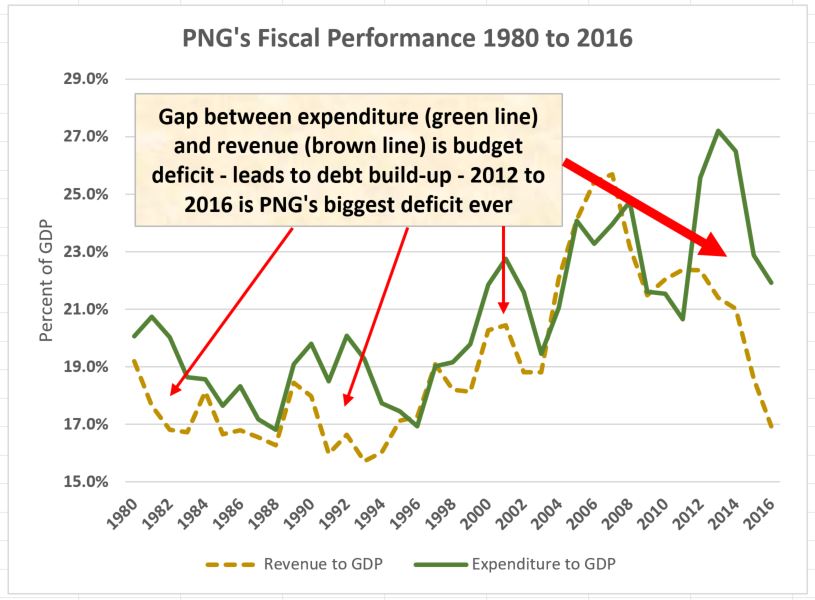
The reason behind PNG’s huge deficits is analysed in the following graph.  The deficit is the difference between government revenues (shown by the green line) and government expenditures (shown by the blue line). These are expressed as shares of GDP to provide a historic perspective. There are two key features of this graph.

PNG exp and revenue 41 years

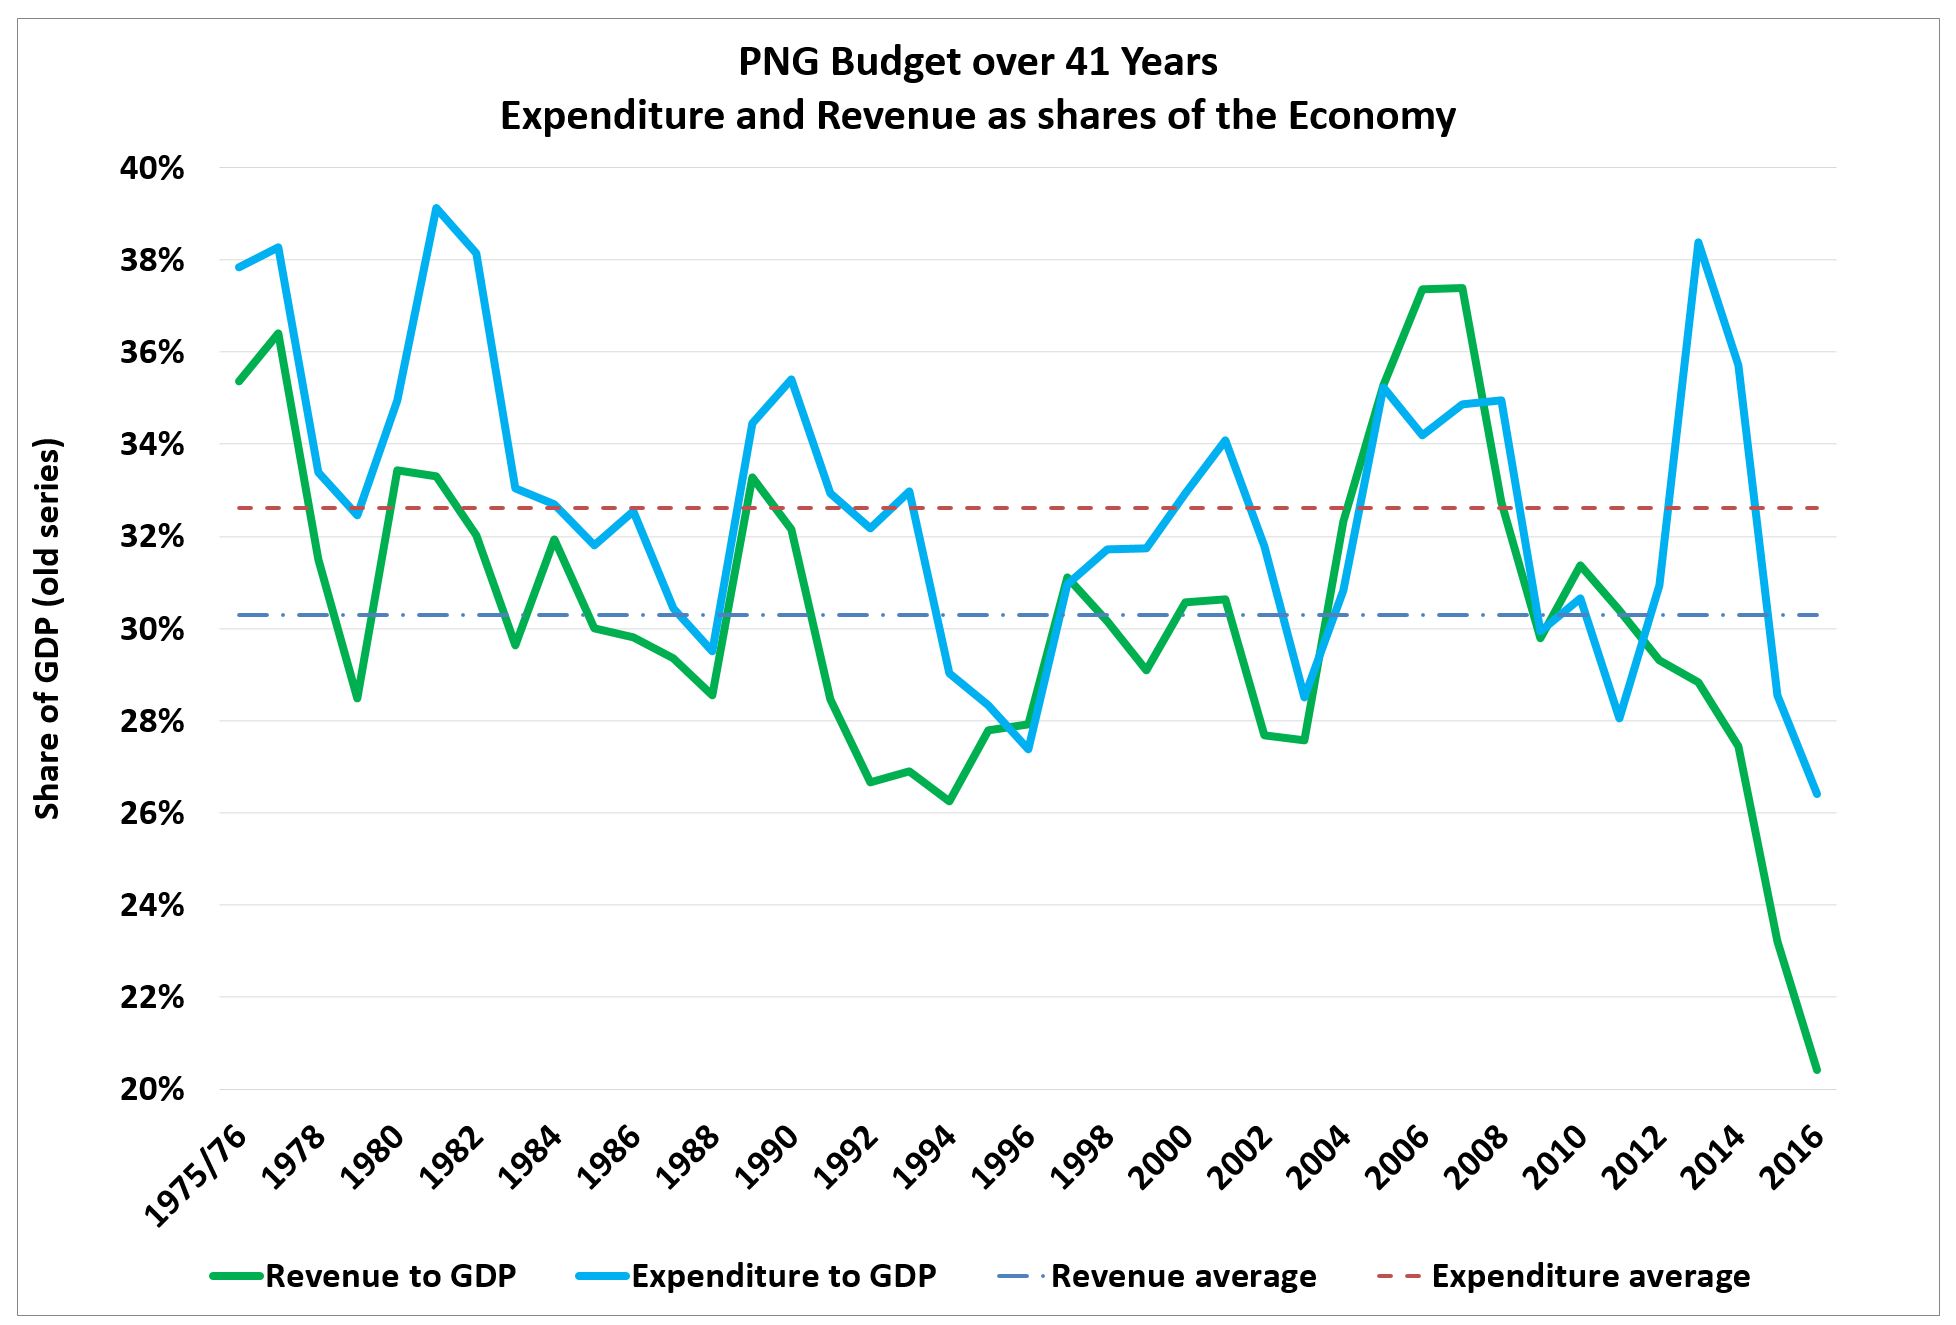
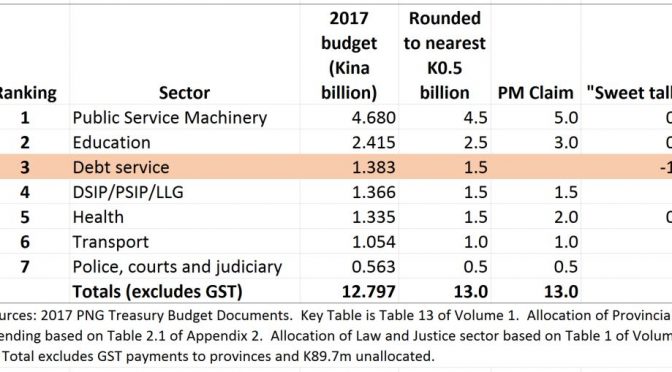
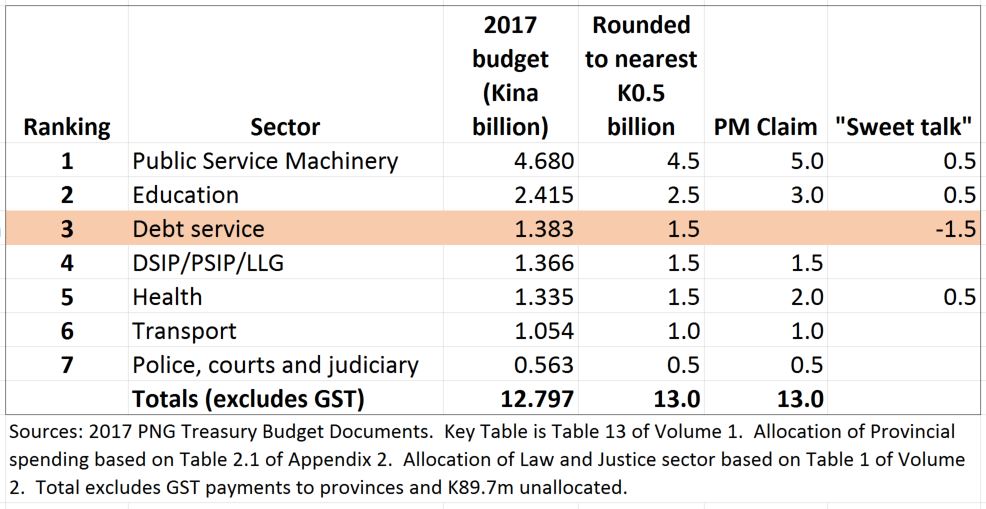
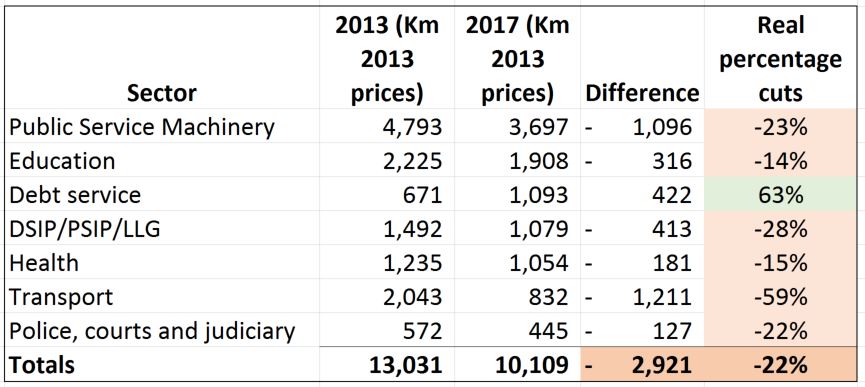
First, the expenditure expansion in 2013 by the O’Neill government was unprecedented in PNG’s history. Many of the government’s commitments were very expensive – such as the move to district financing through MPs as well as giving parents’ an effective tax cut by abolishing tuition fees. These expenditure commitments were made before income was received – counting the chickens before the eggs had hatched. From 2015  (after a delayed response) PNG has embarked on severe expenditure cuts – more severe than those imposed on Greece. Earlier articles – see here and here – indicate that the majority of these cuts, contrary to government claims, have been in the key areas of education, health and infrastructure.

The second striking feature of the graph is the collapse in revenues.  Revenues have never been so low as a share of the economy.  Previous posts have demonstrated (see here) that the main reason for this is not the fall in international commodity prices but because of the weakness in the overall economy of PNG and a diversion of dividend funds to Kumul Petroleum (rather than through the Sovereign Wealth Fund and back into the budget). This is the key areas of budget repair that has been ignored by government – there is a need to do something to fix the collapse in revenues. The Sir Nagora Bogan tax report provided a possible roadmap for recovery and improving economic efficiency. The low level of taxation of the resource sector – including logging – is a major issue that should be addressed to help restore some of the severe cuts to health and education.

The FBO confirms further major reductions in personal and company income taxes reflecting the current weakness of the PNG economy. The FBO also effectively admitted that the government was partially responsible because of its poor management of foreign exchange – “Foreign exchange imbalance also dampened business activities thus lower tax revenues” (sic) – page 8 of FBO.

And as even the Treasurer has pointed out, from 2016 onwards, economic growth rates of 2 to 3 per cent are lower than the population growth rate – so income per capita is forecast by the PNG Treasurer and PNG Treasury to keep falling over the next four years. PNG is going backwards economically – and this situation is expected to continue for years.

There is no practical vision for getting PNG back onto a development path. As the PNG LNG project has indicated, it would be foolish for PNG to put much belief in the hope that the resource sector can transform life on the ground for most Papua New Guineans.

The composition of expenditure cuts points to very poor budgeting and planning systems. In particular, the government indicated in its supplementary budget that it would be cutting expenditure by K928m for the remainder of 2016. In the end, the cuts amounted to only K262.2m. Staffing costs actually exceeded the Supplementary Budget by an extraordinary K471.0 million. Some deeper analysis of Appendix D in the FBO indicates most of this was for teacher salaries where the Supplementary Budget figure of K1,023 million was exceeded by K317.6 million. Such a massive difference of 31% in such a large and key area points to a lack of planning ability. The Tuition Fee Free Education policy was inevitably going to require more teachers and the government knew that teacher salaries were being increased – but such obvious costs did not flow through to the budget. This is poor management.

As usual, there are some hidden gems in such budget reports. For example, Table 33 on the K100 million spent through the “Secretary’s Advance” by Dairi Vele included K1,608,400 “to settle bills for Javati/Twivey Lawyer” and a rather unusual K18 million paid by the Electoral Commission to the Washington Embassy.

The performance information in Appendix 3 for many major projects (apart from those on road infrastructure) are difficult to reconcile. For example, the first item called “Provincial Hospitals Infrastructure” project is rated as 70% complete and operating to standards. However, this project expected to receive K225 million in 2016, this was severely cut to K160 million in the Supplementary Budget, and only K23 million was actually provided.  How did this project complete 70% of its activities with only 10% of the expected budget? Such dubious performance reporting undermines other claims by government that it is achieving its Alotau Accord targets

Going forward, the extent of changes between the 2016 FBO and the 2016 Supplementary Budget has significant implications for the 2017 Budget. In particular, the Supplementary Budget assumed that revenues would increase by K928m but the FBO indicates revenue actually fell by K1,236.7 million – a difference of K2,164.7 million. Some of these lower revenue numbers, in particular the lower tax revenues, will flow into lower revenues in 2017. Likewise, some expenditure areas will be much higher than indicated in the 2017 budget. The starting base for staffing costs is now K471.1 million greater than expected and the government has shown no ability to curtail staffing costs. The K1,102.7 million reduction in goods and services expenditure late in 2016 as part of the close of accounts process could also partially represent simply a deferral of bills. Some of these bills will now have to paid in 2017 or defaulted on by the government – at the risk of hurting businesses and others owed money.

There is little doubt that the 2017 budget is now significantly off-track and a much larger deficit is inevitable.  The 2017 budget needs to be redone.


PNG’s budget deficit blow-out of K628 million

Summary

  • This is the third and final posting on PNG’s 2016 IMF Article IV report.  The two previous posts have focused on PNG’s growth rate being much lower than claimed by the O’Neill government and PNG’s weak external position. The focus of this blog is on fiscal and monetary policy.
  • The IMF report estimates the 2016 budget deficit will be K628 million greater than estimated by the government (so reaching 4.4% of GDP), and this feeds into greater debt levels.
  • Government debt at the end of 2016 is estimated to be K967.3 million greater than stated by the government (and this does not include build-ups in off-budget debt such as the K3 billion in borrowings for Oil Search shares).
  • While commending the government for its actions in the 2016 Supplementary Budget and “prudent” 2017 budget, there are concerns about where expenditure cuts have been made, the lack of effort on raising revenues (in particular from the resource sector), and the need to improve public financial management.
  • The IMF appears not to have been fully informed of the central banks printing of money through back-stopping government auctions.
  • Overall, I can understand why the government tried to suppress this report by an independent umpire.  The IMF provides a few positive comments on high level fiscal policy, but overall, it is a pretty damning report about the O’Neill government’s economic mismanagement.

Details

Fiscal Policy

The IMF report estimates the 2016 budget deficit will be K628 million higher than claimed by the O’Neill government. The IMF estimates the deficit will be K2,740m or 4.4% of GDP . This is significantly higher than the government’s estimate of K2,112m  or 3.1% of GDP.  (Figures from Table 2a and 2b of the IMF report relative to the figures in the 2017 budget Table 1).

The IMF estimates government debt being nearly one billion Kina higher than that claimed by the O’Neill government (IMF says K20,752 million and 33.5% of GDP; O’Neill government 2017 budget estimates K19,784.7 million and 29.4% of GDP). (Figures from Table 2a and 2b of the IMF report relative to the figures in the 2017 budget Appendix 3 Table 12).

In addition, there are unknown levels of off-budget debt. For example, the estimated K3.1 billion in loans for the Oil Search shares is not shown in these figures. Indeed, the IMF states when commenting on the “comprehensiveness and transparency” of government accounts that “the extent of unreported government operations appears to be large” (page 22).

On a positive note for the government, the IMF considers that at a macro level the government has been pursuing a “prudent” fiscal policy since late 2015 when it finally started to adjust to the collapse in revenues.  However, this of course avoids the issue of the blow-out in budget deficits over 2013 and 2014 which clearly were not sustainable. Put simply, the O’Neill government created a huge fiscal mess in its early years and it had little option when its gambling on commodity prices did not pay off.

Underneath this high level fiscal policy, the IMF expresses concerns about the pattern of expenditure cuts.  In particular, the IMF suggests expenditure cuts should be “concentrated in provincial district government spending” – so the DSIP and PSIP.  These areas of expenditure are regarded as having the least contribution to growth and the weakest governance processes. However, this would not suit sitting members of parliament.

The IMF considers that “additional revenue measures should be implemented to lessen the need for expenditure cuts” as part of a comprehensive tax reform package following the Sir Nagora Tax Review in 2015.

For the 2016 budget, the IMF expresses diplomatically concerns about the expected level of asset sales and dividends from State Owned Enterprises.  These were not considered likely.  The Final Budget Outcome (FBO) at the end of March 2017 should show the actual figures. However, given what appear to be “convenient” manipulations of statistics recently, I am not confident in the unbiased results of this year’s FBO.

Looking ahead, the IMF is cautious about rushing to a return to budget surplus given PNG’s pressing development needs.  In its usual diplomatic language, it states “The pace of fiscal consolidation should be carefully calibrated to avoid a sharp contraction, implying a more gradual adjustment than specified in the MTFS” (Medium Term Fiscal Strategy).

I would agree with this view – the expenditure cuts that have been imposed on the people of PNG are greater than those imposed in Greece. Cuts of close to 45% in real terms in areas such as health and education make a mockery of claims that these critical areas have been protected from government cutbacks. For example, the “free health” policy is costed at only K20 million a year.  Clearly, this is nowhere near the level that would be required to actually deliver a “free health” service of any quality in PNG. The cuts in the health budget in 2016/17 alone were over fifteen times the size of this “free health policy”. There is a need for a better balance of greater revenues (see below), a better and more realistic medium-term fiscal strategy, and expenditure cuts focused in administrative and political areas rather than in service delivery.

The IMF also discusses the 2017 budget only having “broadly realistic revenue projections” without specifying which budget assumptions may not be realistic (the tax compliance revenue gains have not been delivered in past years and are unlikely to be delivered in 2017).

The IMF also indicates that “the tax arrangements for PNG’s mining and petroleum sectors are very generous compared to other resource rich countries and do not reflect the maturity of the PNG resource sector”. Indeed, the IMF states “there is considerable scope for improving the fiscal regime for extractive industries”.

The backdowns in the January Parliamentary session over increasing the returns to PNG from taxing log exports also reveals the power of the forestry sector in PNG.

PNG landowners and the broader populace are missing out.  There are clear areas where revenues could and should be increased.

Monetary policy

On monetary policy, the IMF appears to not have been informed about an extremely worrying development in 2016 – the return of the central bank to printing money (see here). On the basis of more recent figures from the BPNG released after the IMF mission, it appears the IMF was not informed of the extent of money financing of the deficit during 2016. Specifically, the IMF report is based on BPNG’s net credit to the central government being K1,713m in 2016 (Table 4 p32 of the IMF report) when that figure has increased by 58% to K2,717m by the end of September (latest BPNG quarterly data).

BPNG has returned to a position of backstopping all auctions for government bonds and essentially printing money.

If the large 58 per cent increase had been known by the IMF, there would have been much more discussion of the significant inflationary and other risks of such an increase in central bank financing of the deficit.

However, even without these details, the IMF was concerned about “large money-financed fiscal deficits”.

Conclusions

Overall, there are significant gaps between the stories of the O’Neill government and the information provided by the IMF. These go to the heart of whether the people can trust the government. Based purely on the IMF report, an internationally recognised independent umpire on such numbers, recent posts on the pngeconomics.org website detail how the 2016 budget deficit is likely to be K628 million bigger than the people have been told. Government debt is nearly a billion Kina bigger – and that doesn’t include debt being hidden off-budget. Economic growth is 12.7% lower than claimed. The economy is K6.3 billion smaller. The government debt to GDP ratio at 33.5% exceeds the legal limit. Expenditure cuts are too severe and being made in the wrong places. More could be done to get a decent return to the people of PNG from their resources. PNG’s external position is weak, with import coverage only about one-third of the recommended levels despite the foreign exchange restrictions.

It is interesting that PNG’s major local papers have not covered the outcomes of the IMF report on PNG but did so for the recent IMF report on Australia. Something is wrong about reporting, and it also goes to the heart of trust.

Overall, I can understand why the government tried to suppress this report by an independent umpire.  The IMF provides a few positive comments on high level fiscal policy, but overall, it is a pretty damning report about the O’Neill government’s economic mismanagement.

PNG’s ‘weak’ international economic situation

Summary

  • The recent IMF report indicates PNG’s international economic situation is much more frail than the picture presented by the O’Neill government.
    • Indeed, the IMF calls the foreign reserves position ‘weak’.
  • PNG has less than one third the recommended level in its international bank account.
    • And this is despite the foreign exchange rationing that is hurting PNG business, investment and jobs.
  • PNG’s published import coverage ratios are misleading and out of step with internationally accepted definitions. Specifically,
    • PNG claims foreign reserves cover 13.0 months of imports while the independent umpire, the IMF, says the figure is only 3.2 months of imports.
      • The suggested level for a country such as PNG is around 10 months of imports.
      • PNG has less than one-third the prudent level.
    • PNG says the import coverage ratio for non-mineral sector imports has increased by 28% over the last five years.  This appears to show a healthy improvement in PNG’s external position. However, foreign reserves actually fell by 61% over the same time period (see graph below). Something is not right.
    • Fixing this external weakness requires improving PNG’s foreign exchange reserves. The best long-term solution is making the PNG economy more competitive. But in the short-term, hard choices are required in balancing growth with unacceptable international risks.
      • So even if PNG gets an extra $US300m from Credit Suisse,  some of this should be put into foreign reserves to build up buffers rather than relaxing the already crippling foreign exchange restrictions.
      • Better policy options were available to deal with the fall in commodity prices. Most commodity exporters undertook these. However, poor economic decisions by the O’Neill government means PNG is facing a much more complicated economic mess and a tougher path to recovery.

Detailed analysis

The International Monetary Fund’s 2016 report on the health of the PNG economy shows PNG’s international economic situation is much more frail than presented by the O’Neill government.

A key measure of international economic health is how many months of imports can be paid for by a country’s foreign exchange reserves. This is equivalent to a how long a family can survive on its bank savings to get through some unexpected tough times.

BPNG appropriately uses two import measures.  The first looks at all imports, the second concentrates on non-mineral imports.  As the non-mineral sector provides jobs and incomes to most people in PNG, this split makes good sense.

However, BPNG does not use internationally agreed definitions for these two import measures. BPNG only includes goods imports and excludes service imports. BPNG also appears to use data on recent import levels that are not publicly available. And a broader problem is PNG does a pretty lousy job in actually measuring imports – these are significantly lower than other countries’ export figures to PNG. This is a recognised problem but only slow progress is being made to fix it.

So the figures used by the PNG government give a misleading view on the actual health of foreign reserves.  As highlighted in yellow in the table at the end of this article, the government is claiming foreign reserves are the equivalent of 13.0 months of imports – a pretty healthy level.  But the IMF says the real figure is only 3.2 months of imports – less than one-quarter as healthy as the level claimed by the O’Neill government.

The discrepancies are even more pronounced when looking at the health of non-mineral import coverage.  The government claims it has improved from 16.6 months in December 2011 to a massive 21.2 months in October 2016.  This claimed “improvement” in the health of PNG’s external situation is shown by the red line in the graph below.  However, the actual level of foreign exchange reserves (the bank account that can pay for on-going imports) has actually fallen by 61% from $US4,350.1m to $US1,705m.  The claimed measure of health goes up by 28% but the underlying level of health goes down by 61%.  These are some very convenient statistics for the O’Neill government.

IMF Article IV Falling reserves but increasing import coverage

Clearly, part of the explanation is that the level of imports has been drastically reduced because of foreign exchange restrictions – from over $US260m per month to only $US80m per month. This drastic decline is not driven by increased local production but by excessive foreign exchange restrictions which are hurting businesses and consumers in PNG. As such, the apparent improvement is simply hiding a major decline in the opportunities in PNG and its standard of living.

Recommended foreign exchange levels

So if we use the IMF figures instead, what are the implications of foreign exchange reserves being 3.2 months of imports?

A very old rule of thumb was that a country’s foreign reserves should stay above 3 months of imports. So PNG was just above the minimum level with 3.2 months.  However, in recent research released by the IMF in June 2016 (see here) a more tailored approach has been taken based on the experience of countries such as PNG.  This IMF research indicates  PNG should actually have at least 10 months of imports in its international buffer of reserves (and possibly closer to 12 months) [see final graph on page 23 of the PNG IMF Article IV 2016 report and the description of the metrics in the June 2016 IMF paper].

PNG has less than one-third of the internationally recommended level in its international bank account.

PNG would need another $US3.6 billion in its international reserves as a precautionary buffer to meet international risks.

Conclusion

The policy implications of PNG running down its international reserves have been hidden by using misleading and excessively rosy measures of external health.  PNG should move to accepted international measurement standards.

PNG is also using old views on the adequacy of international buffers such as the “3 month import rule”.  PNG’s government should keep up with modern understandings of how to properly run an economy.

The IMF report puts these concerns in its usual very polite and diplomatic language: “PNG’s external position is moderately weaker than implied by fundamentals and desirable policies, given its weak gross foreign reserve position and overvalued real effective exchange rate” (opening of Box 4 on page 23).

So even the cautious IMF says PNG has a weak gross foreign reserve position and an overvalued currency (a subsequent article will cover the latter).

Economic policy inevitably involves judgements on difficult trade-offs between objectives. The full implications of the O’Neill government’s decisions  to move away from PNG’s market-based exchange rate, especially at a time of falling commodity prices,  are becoming clearer. PNG’s international buffers are only around one-third the recommended levels. More of PNG’s foreign exchange earnings, and at least some of any new international loans, now should be invested in rebuilding these buffers.

Poor economic decisions by the O’Neill government mean PNG is facing a much more complicated economic mess and tougher path to recovery.

IMF Article IV Foreign exchange reserves and import cover detailed table


PNG IMF Article IV Report – Much ado about a lost K6.3 billion

Summary

  • The IMF report indicates the O’Neill government has overstated the growth rate in the PNG economy by 12.7 percentage points during its term.
    • Primarily by 5.9 percentage points in 2014 and a further 5.2 percentage points in 2015 (see graph below).
  • The IMF indicates the PNG economy is K6.3 billion smaller in 2017 than claimed by the government (and K5.4 billion smaller in 2016).
    • This means the debt to GDP ratio is 33.5% in both 2016 and 2017 according to the IMF – above the 30% limit set in the Fiscal Responsibility Act.
  • The greatest concerns about economic management relate to BPNG’s control of the foreign exchange rate and reserves with more breaches of international norms than admitted.
    • The Governor of the BPNG should explain serious discrepancies between his statements on 25 January (full page adds in the local press on 26 Janaury) and what the IMF report actually stated on 27 January (see below).
  • While commending the government for its actions in the 2016 Supplementary Budget and “prudent” 2017 budget, there are concerns about where expenditure cuts have been made, the lack of effort on raising revenues (in particular from the resource sector), and the need to improve public financial management.
  • Structural reforms need to be accelerated for private sector development.
    • There are concerns about current elements of SME policy.
  • Short-term risks are tilted to the downside, although the medium-term prospects of further resource projects balance this out.

Details

Fortunately for the country’s credibility, and after a foolish delay which reflects badly on the judgments of the Prime Minister, Treasurer and BPNG Governor, the PNG government has agreed to the release of the IMF Article IV assessment (see here – a link to the detailed staff report on the IMF site is available here  – as of Sunday night, it had not been uploaded on the IMF site despite several requests to the IMF media office – it has been distributed to registered media contacts and should be available by late Monday).

Playing games with the growth rates and the size of the economy

The most significant issues in the report are the very large differences between the O’Neill government’s statements on the growth rate of the economy and the views of the IMF (which are very similar to those included in the World Bank’s Global Economic Prospects report issued earlier this month).

These differences are shown in the graph below. During the term of the O’Neill government, economic growth has been overstated by 12.7%.  This occurred primarily in 2014 and 2015 with a combined overstatement of 11.1% (very similar to the World Bank’s figures of a 10.9% overstatement).

IMF Article IV 2016 growth differences

This means that the O’Neill government has also been overstating the size of the economy by K6.3 billion by 2017 (and K5.4 billion in 2016).

With the IMF’s estimated size of the economy, the debt to GDP ratio is 33.5% for both 2016 and 2017- above the 30% limit set by the Fiscal Responsibility Act (see Table 1 page 28 of the IMF report).  This contradicts the government’s estimate of 28.8% (see Table 1 page 15 of the 2017 Budget).

In the 2017 Budget, the O’Neill government used a figure of K74.987 billion as its preferred estimated for the size of the economy (see Tables 10 ii and ii and Table 12 in Appendix 3 of the PNG budget).  The IMF says the correct size is K68.7 billion – so K6.287 billion less (Table 1 page 28 of the IMF report).  The error in 2016 was 5.4 billion.

The differences in the GDP real growth estimates, as well as estimated GDP,  are significant and unusually large.  They also were very convenient statistics for the government.  Getting the IMF’s rulings on these figures is inconvenient, and probably the major reason for trying to suppress the IMF report (see here and here).

On the other hand, my previous blogs have estimated that there was a domestic recession in PNG.  The IMF figures indicate that non-resource GDP was indeed positive in both 2014 and 2015 (2.2 and 2.1% respectively), although non-resource GDP per capita is likely to have fallen or remained stagnant (given a PNG population growth rate of between 2.1% and 3.0%).  I an surprised with the IMF estimates in some areas (such as showing a positive increase in the agriculture sector in 2015 despite the worst drought in 20 years and major declines in most of PNG’s agricultural imports).  However, I accept the verdict of the IMF as it is an international authority on GDP estimations.  I hope the government will similarly accept the IMF figures on its breaching of the debt to GDP ratio and a lower growth performance.

Misleading discrepancies on foreign exchange practices

In terms of PNG’s international standing, one of the most disturbing areas in the IMF report was the difference between the press release of the Governor of BPNG on 25 January, included as full page adds in the local press the next day, and what the IMF release actually says the following day (27 January).

For foolish and ill-judged reasons, the Governor of BPNG argued why there was a delay in releasing the report.  It is extremely difficult to reconcile the published reasons from the Governor with the actual report.

Specifically, the Governor argued (see here) the following (reason 3 in the press release) “3. No Breaches of Article VIII – … The Article VIII Mission did not find any breaches of multiple currency practices but still requested the PNG Authorities to
commit to correcting a hypothetical breach, which might or will happen in the future. It is unacceptable for the PNG Authorities to agree to correct something
that may not happen.”

Actually, the report did find something that had happened in direct contradiction to the Governors’ statement to the PNG people – BPNG was breaching these accepted rules of internationally acceptable behavior.  Specifically, the IMF report states there were two breaches (see page 3 of the IMF Information Annex)  “Papua New Guinea also maintains the following multiple currency practices (MCPs) subject to Fund approval under Article VIII, Section 3: (i) a MCP arising from the spread of more than 2 percent between the rates set by BPNG for its FX allocations to authorized FX dealers (AFEDs), and the rates used by AFEDs in transactions with their clients; and (ii) an MCP arising from the potential spread deviation of more than 2 percent between the rates set by BPNG for its FX transactions with the government and embassies, and the rates used by AFEDs in transactions with their clients.”

This sounds technical but it is important.  And the people of PNG entrust the legislatively independent bank of PNG, and specifically that organisation’s leader, to uphold the highest standards across all the technical details of the international system.

The Governor’s Press Release and full page add also stated: “The Tax Clearance Certificate … has never been an issue raised during previous visits by the IMF”.

But once again, it is hard to reconcile this statement with IMF documents.  In 2015, the IMF Article IV report did list the Tax Clearance Certificate as a breach (see here – more specifically, this was the quote from the 2015 report in direct contradiction to the BPNG statement – “PNG maintains an exchange restriction subject to IMF approval under Article VIII, Section 2(a) of the IMF’s Articles of Agreement arising from the requirement to obtain a tax clearance certificate evidencing the payment of all taxes prior to making payments or transfers for certain current international transactions.” (end of paragraph 19 here ).  The 2016 report reiterates this breach  (page 3 of the IMF Information Annex).  So why claim there was no breach? This is difficult to explain, and certainly undermines the credibility of the leader of BPNG and likewise the current government.

And in addition to these two breaches, the IMF report actually finds a third breach of PNG’s obligations under its membership of international economic community.  Specifically, the IMF report states the following is another exchange restriction: “the rationing of FX and its allocation by BPNG to certain priority items, which results in undue delays and arrears in current international payments.”

This finding will not be a surprise to the businesses in PNG that are suffering under the O’Neill government’s foreign exchange restrictions.

Possibly not surprising that the O’Neill government wanted to suppress the IMF report.

Credit for the government’s agreement to the release, but possibly there was no option given public pressure over the last few weeks following the shameful attempt to bury the report.  Hidden secrets have been revealed, and this will form part of the democratic assessment of the management of PNG’s economy.

Certainly, the IMF, the respected international assessor, is saying the management of PNG’s economy is not as good as the government is claiming.

Additional detailed issues.

As foreshadowed in the Summary, there are other significant times in the IMF Report.  Given the length of this post, I’ll cover those in my next blog.