All posts by pngeco5_wp

PNG LNG Technical Analysis of “Underlying Growth” Sensitivity

The “Double or Nothing” Jubilee Australia report on the PNG LNG project generated considerable interest and comment. Included within that was a request for more detailed information on the sensitivity analysis of the report (this analysis was mentioned on page 17 of the report, with 2 key alternative assumptions covered in Footnote 22). This information is provided below.

Consistent with the professional standards of “Jubilee Australia”, linked to the think tank of the “Australia Institute”, the draft report had to go through a peer review process. This earlier peer review process was concerned the analysis of nine alternative growth scenarios across two time periods was too long and technical for the key audiences for the report – and that was not economic research professors!

However, I considered enough detail was provided on page 17 of the “Double or Nothing” report to make clear for any technically minded reader (along with the transparent detail of Table 5) that on any reasonable assumptions of underlying growth rates, ACIL-Tasman’s muddled model lacked credibility and the conclusions from the Jubilee Australia (JA) were vastly more robust, transparent and clear.

The information included in the draft report (as ‘Appendix 2’) is below. In addition, looking at all the macro-economic indicators (rather than just GDP), the ACIL-Tasman analysis would have required negative growth every year for nearly a decade to support its claims of massive benefits.  This is just not credible – the model was seriously muddled.

Looking through the final version of the report, there was a proof-reading error. As part of the peer review process, it was considered the term “baseline” was not clear enough. So through-out the 45 pages of the report the term was removed and more detailed language around “actual relative to underlying growth path” was included, with very clear indications of how that underlying growth path was determined. However, this update was not included in the relevant column heading in Table 1 (it was in Table 4 and the detailed Table 5) as well as one of the graphs. Apologies for not picking that up.

“Appendix 2: Sensitivity analysis for GDP

A key element of the PNG LNG economic model was comparing predicted outcomes relative to a “baseline”. Specific information is not provided on that baseline – it is the level of the economy expected at a particular point in time without the project compared with the same point in time with the project.

The basis for determining the baseline was discussed in Box 1 [a simplified version is now Appendix 2 of the Jubilee Australia report], especially for the most publicised “doubling of GDP” prediction.

The impacts of choosing different growth rates or different starting levels is explored in this sensitivity analysis. Different growth rates, from minus 10 per cent per annum through to a positive 9 per cent per annum, were used. The 2008 starting year was also compared to having 2012 used as the starting year. The results of this analysis are summarised in the Graph xx below. To get a figure close to the PNG LNG “doubling of GDP” claim which was frequently used by project proponents, the model would have had to assume the real growth rate was minus three per cent for every year from 2008 forward. This would have involved a decade of deep recessions. If 2012 was the base year, a negative growth rate of minus ten per cent per year would have been required. Clearly, this assumption did not match with the reality PNG or of almost any economy in the modern world. Even if a growth rate equivalent to just the population growth rate of 3 per cent was chosen, this still would have produced an outcome of only 26% above baseline from a 2008 base year, or 17% above baseline for a 2012 base year – still only a small fraction of the PNG LNG prediction of 97%. Even using a much more conservative growth figure (and one considered unrealistically low as explained below based on evidence from the time) this does not have a significant impact on the key theme that the PNG LNG model wildly over-stated the actual gains from the PNG LNG project.

The following table examines the issue of the appropriateness of using a figure of 4.8% for the GDP growth rate – the average of the three years 2007 to 2009. Using the available data of all three-year weighted averages, it is only the years 2011 to 2013 which produces a lower real growth figure – the other six years are higher. Indeed, over these eight time periods, the average real growth rate was 6.1%. Comparisons are also made with three year average growth rates assumed from budget estimates at the time of the PNG LNG report. Once again, only one three-year average figure is less than 4.8% used in this report – the other five are higher and the overall average is 5.1%. In summary, the PNG economy was growing at around 5% in real terms during most of the 2000s. This was consistent with budget estimates at the time. It also implies a real per capita growth rate of just 2% per annum – presumably an absolutely minimum rate to improve PNG’s prospects and a rate that has been exceeded by PNG’s Asian neighbours. Using the 4.8% real growth assumption is considered robust, if not conservative, and using even lower growth rates would not change the fundamental story that the PNG LNG economic analysis of impacts is a very, very long way from what actually happened.

PNG LNG project – detailed sectoral impacts

Executive Summary

The PNG LNG project is having a very negative impact on the PNG economy during its current production phase (2014 to 2035?). The most likely explanation for this is the poor “resource curse” economic policies  by the O’Neill government induced by the project.

These negative impacts will continue to grow and by 2020 will swamp the initial GDP boost from beginning gas exports in 2014.

The project had a positive impact on the non-resource economy in the construction phase (2010 to 2014) – slightly greater than the level predicted by project partners of 5%. The boost to the LNG sector was almost exactly as expected. In 2016, its direct impact on GDP is a gain of some 14.4% – more than off-setting falls in the mining sector.

However, the policy implications of the project have been poorly handled by the O’Neill government. There was both a failure to capture the gains during the construction phase, as well as the introduction of policies than run directly opposite to recommendations on how to handle the potential “resource curse”.

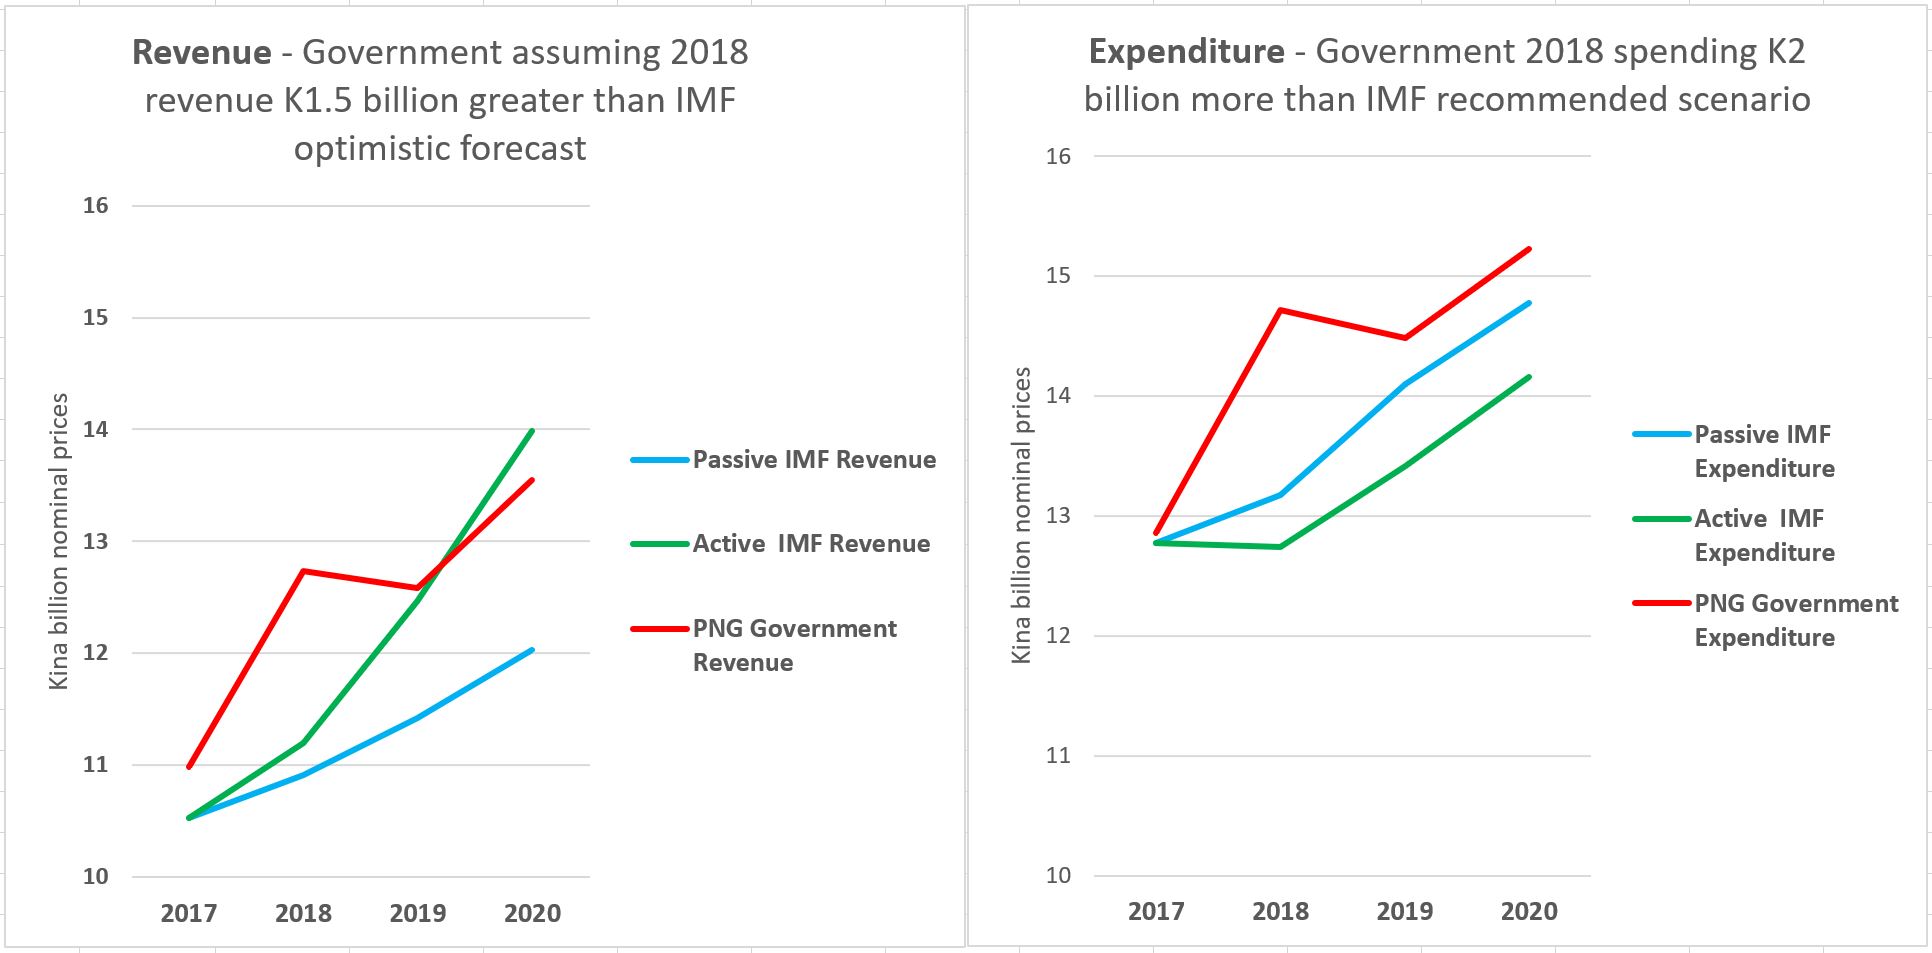
Budget policy fell into the “presource curse” of spending before revenues were received and PNG has experienced its worst budget performance since Independence.

The exchange rate was locked in at an unsustainable level leading for foreign exchange shortages that are crippling the economy – reversing lessons from the 1990s.

Poor investment choices were made such as buying into Oil Search.

In a self-defeating attempt to support the agriculture and manufacturing sectors, PNG is moving back down a path of protectionist policies that will damage growth prospects.

Examining PNG’s policy responses over the last six years, these adverse policy choices are clearly linked to the PNG LNG project and inflated hopes of its potential.

The PNG economy should be able to sustain an underlying growth rate of 5% per annum. It did so with better economic policies, as well as some luck, in the period after the structural adjustment programs in the early 2000s. PNG’s people need better policies to return to at least a 5% growth path. Growing at 5% per annum for the next 15 years will simply return PNG to the level of economic welfare (real non-resource GDP per capita) that it had 35 years ago.

The easy path for hitting a big overall GDP figure by 2024 is to focus on more big resource projects – the potential resource “super-cycle”. A more sustainable and inclusive way forward is to focus policy attention on the non-resource elements parts of the economy. This is harder, and more indirect, but a much better option than the current boom/bust experiences of PNG’s resource curse. New resource projects could be promoted if they sustain-ably increase PNG’s non-resource potential. If the benefits mainly go overseas, then other options should be actively explored.

Key Results

The following graph shows the comparisons between  PNG Treasury estimates of resource and non-resource GDP and a 5% trend line from 2008 (which is a conservative base as it was a recession year in PNG according to the PNG National Statistics Office with a negative change in GDP – reflecting the Global Financial Crisis).

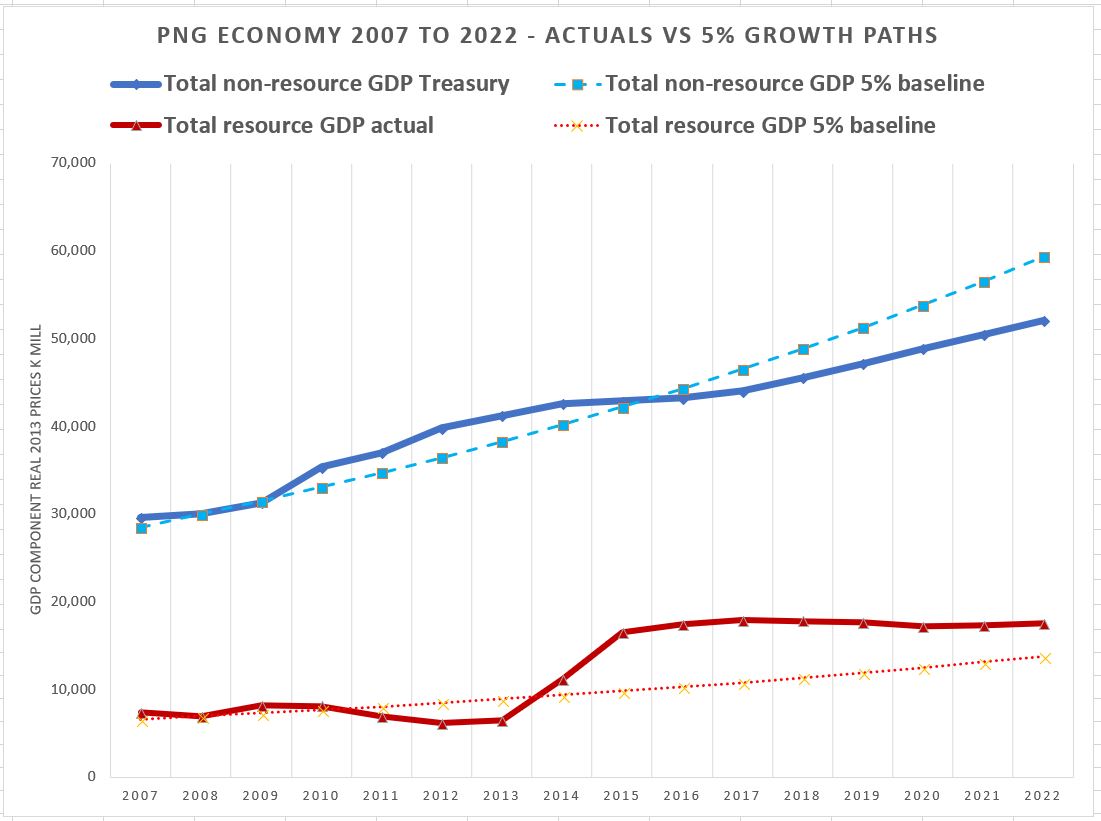
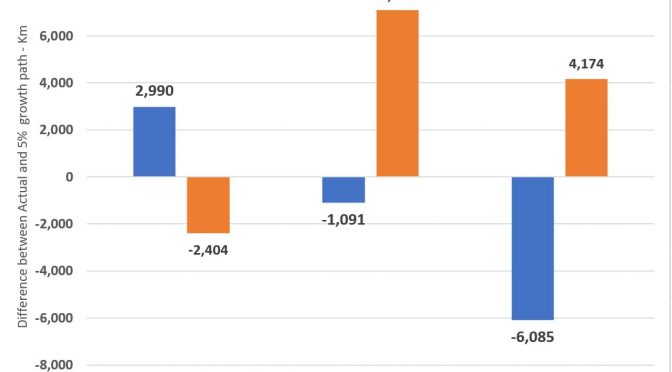
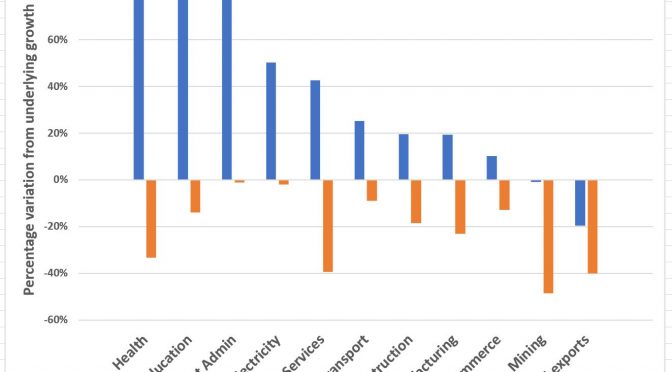
The gap between actuals and the underlying trend indicate how the PNG LNG project, and the poor “resource curse” policies that it helped induce, have impacted on the overall economy. These differences are summarised in the graph below.

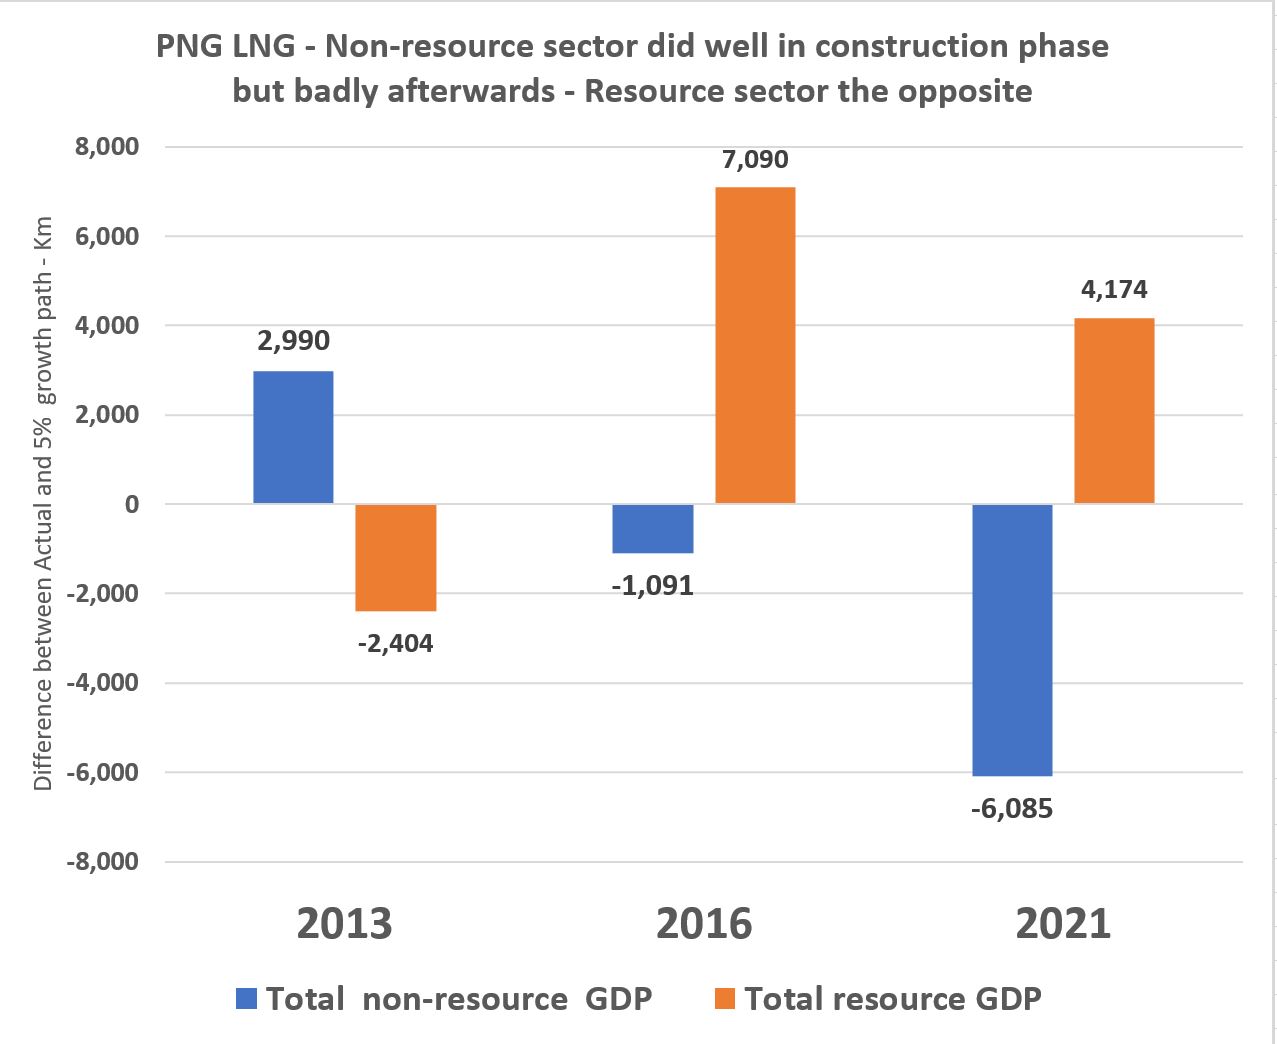
Overall, the important non-resource sector of the economy grew above an underlying trend growth path of the economy by K3 billion in 2013 – a gain of 8%. This suggests the ACIL-Tasman analysis estimates of a 5% flow-through to the remainder of the economy were slightly under-estimated.

At the end of the construction phase,  the non-resource economy had moved below its underlying trend growth path by K1 billion in 2016 – so a fall of some 2%.

However, the turning on of the gas taps means that the way economists measure GDP (which has many limits) saw a jump in the resource sector of K7 billion higher than trend growth.

By 2021, using PNG Treasury GDP forecasts from the 2018 Budget, the non-resource economy would be some K6 billion lower than the underlying growth path, more than off-setting the still positive contribution from the resource sector (including PNG LNG) of K4 billion.

Key Sectoral Results

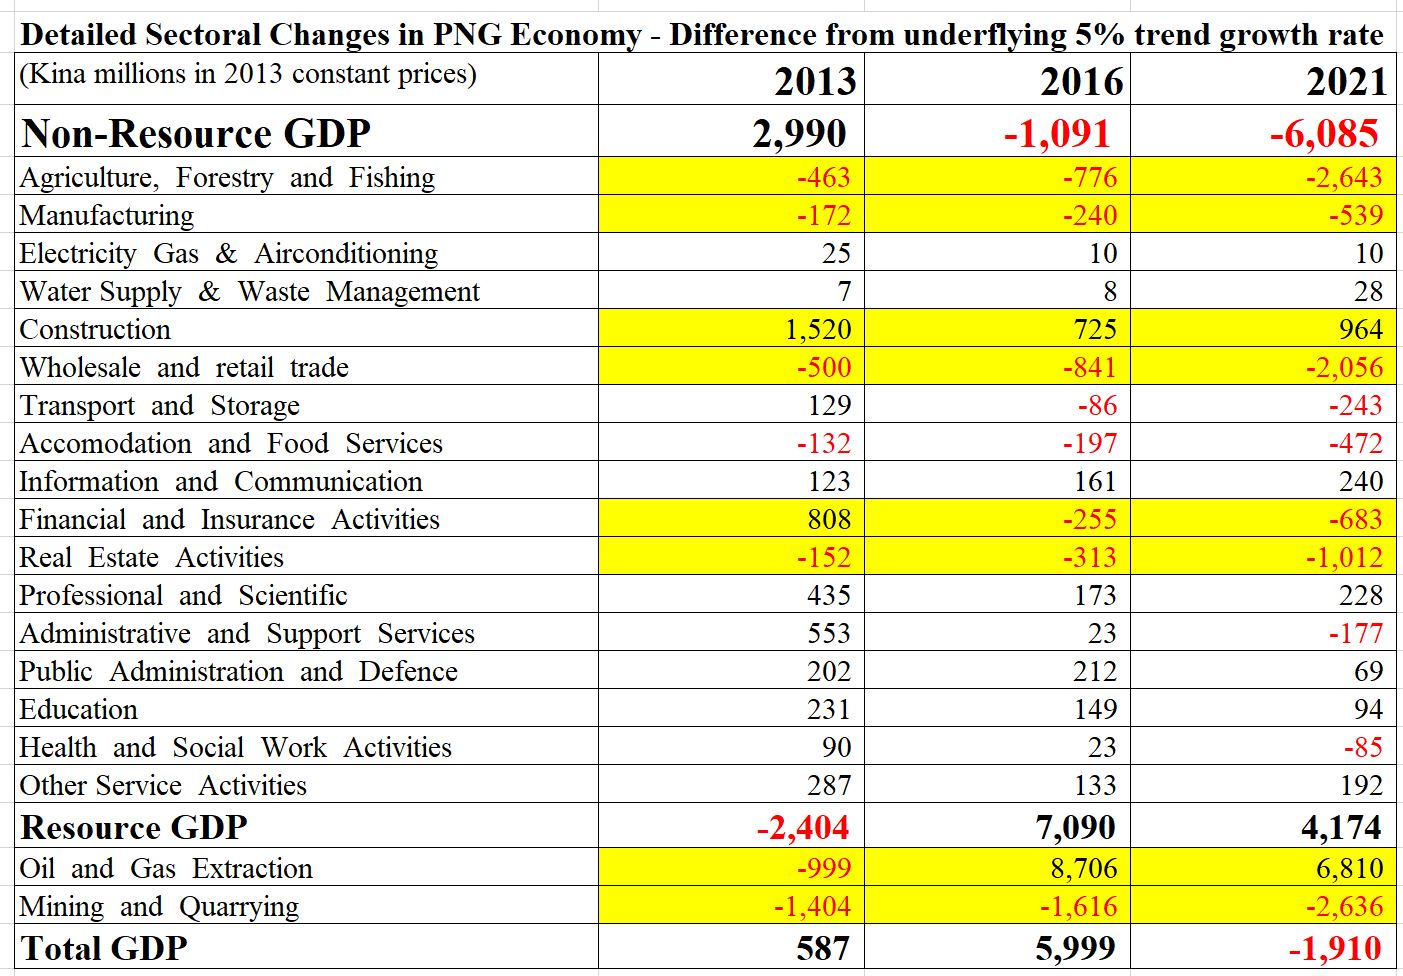
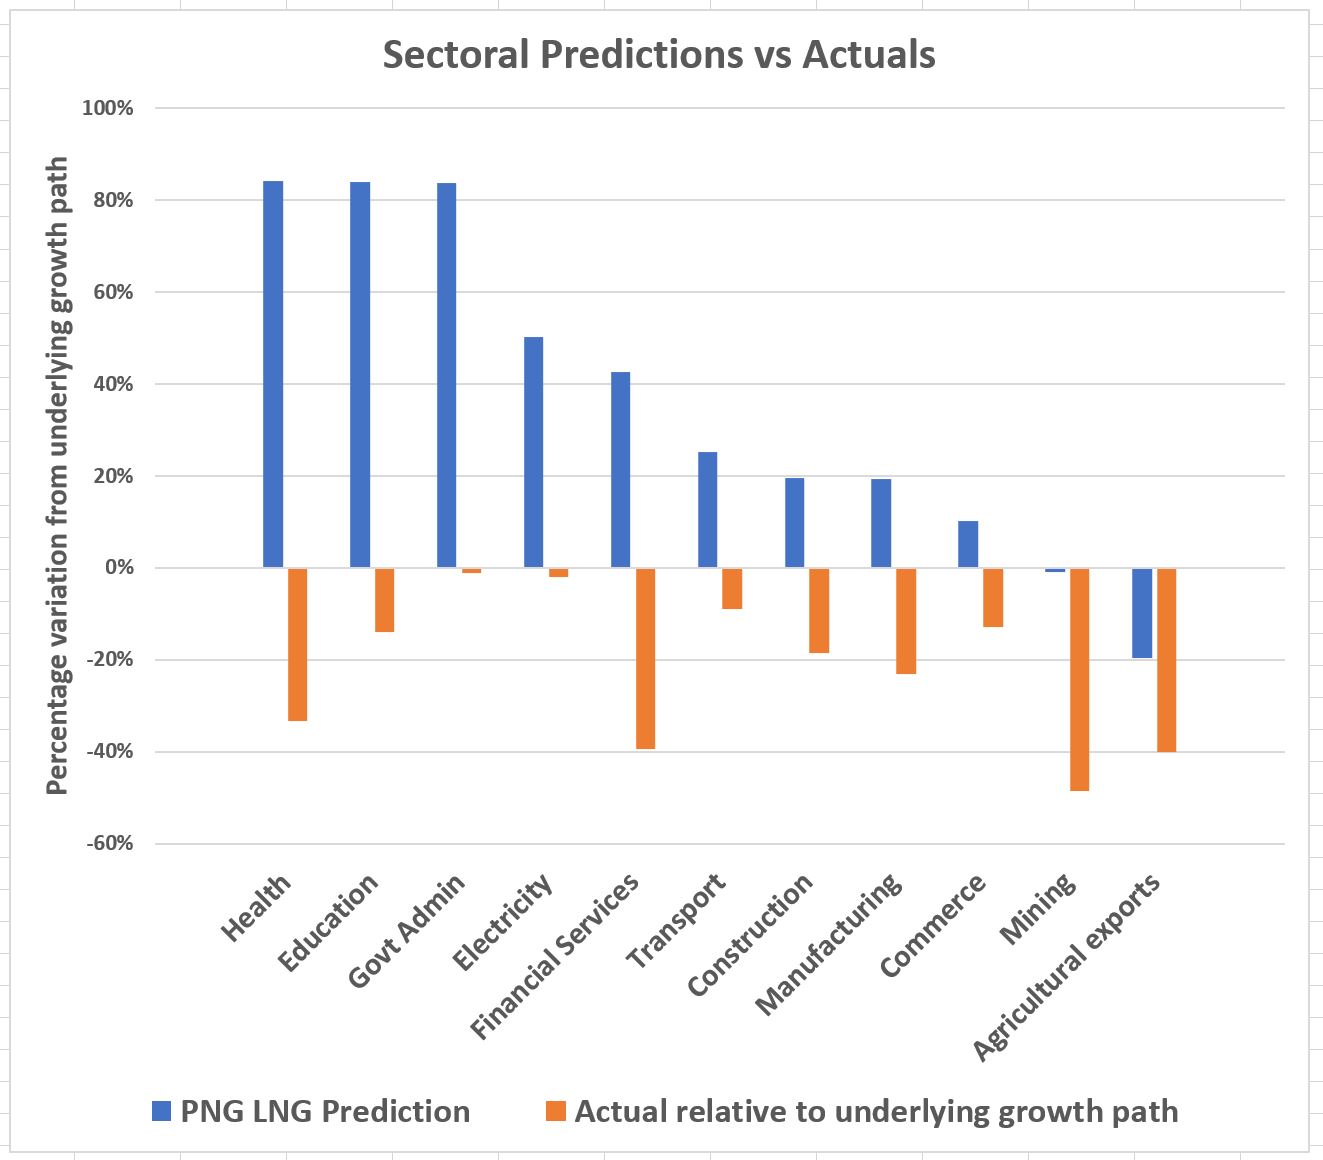
As expected for a new major resource project, the likely major indirect winner was the construction sector which has and continues to do well –  an overall gain of some K1.5 billion per annum during the construction phase and still an estimated K1 billion by 2021. Other service sectors closely linked to the resource sector did well, although the gains are slowly receding.

Also as expected, losers were other parts of the economy involved in international trade – especially agriculture and manufacturing. These sectors have been particularly hard hit and have fallen to well below underlying growth trends.

More surprisingly, based on PNG Treasury figures, the project is having negative impacts also on the wholesale and retail trade sector, the real estate sector and (after the construction phase) even the finance and insurance sectors. These adverse impacts are likely driven by the resource curse policy responses induced by the project, especially the foreign exchange restrictions limiting imports and foreign investment.

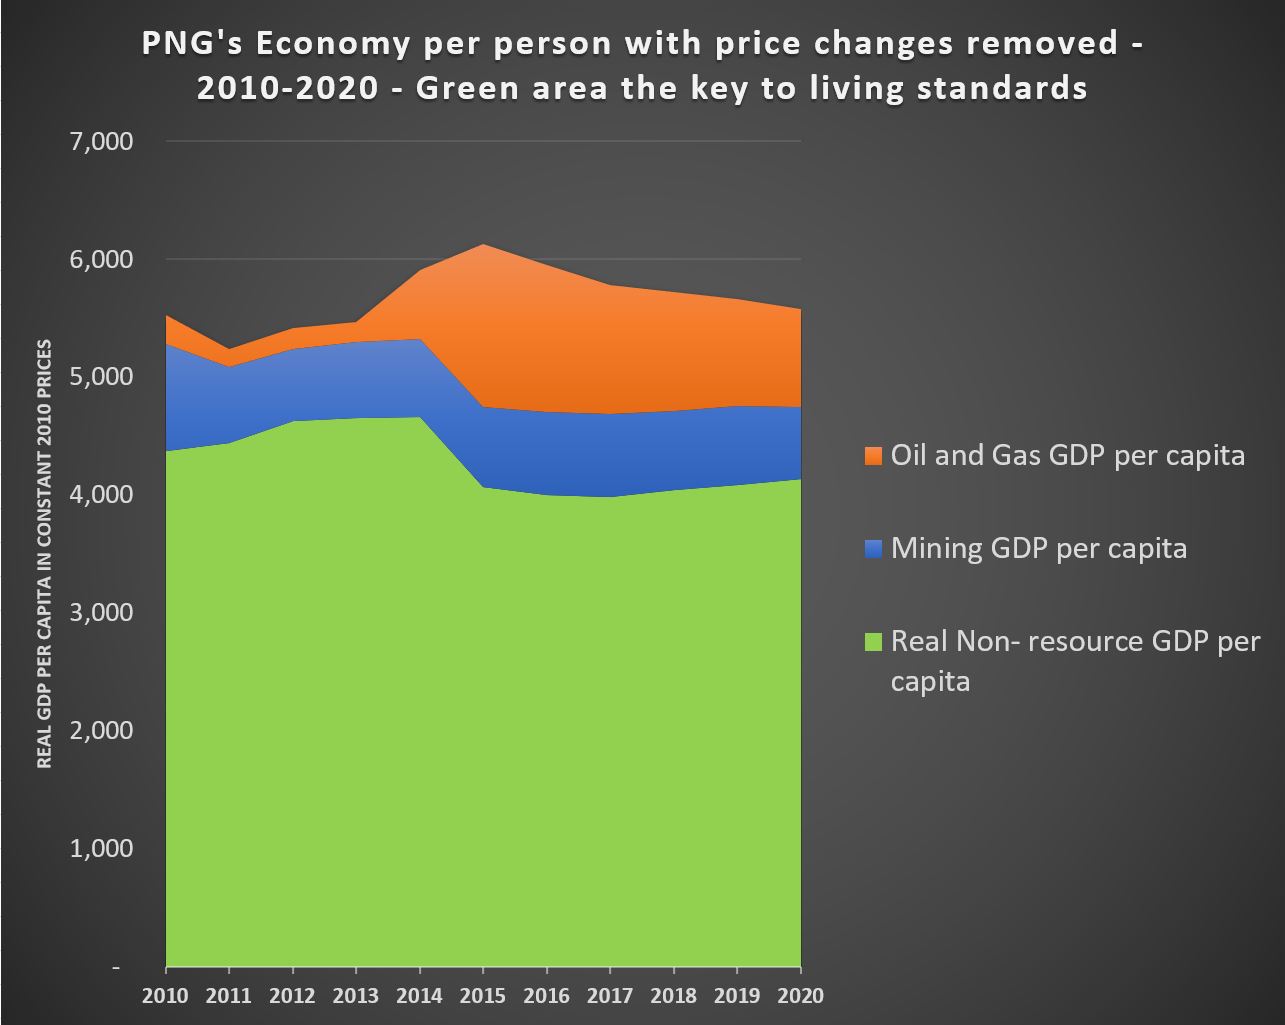
Within the resource sector itself, the petroleum and LNG sector has done very well while the mining and quarrying sector has declined. This is an expected impact from a major new project (competition for scarce skilled labour, higher exchange rate costs) but given the relatively small size and concentration of the sector in just a few mines, it largely reflects the general decline in productivity of old mines (especially Ok Tedi) not being offset by new mines (such as Ramu Nickel).

These changes highlight how differently the PNG LNG project has impacted different parts of the economy.

PNG’s peoples would have  been better off without the O’Neill government “resource curse” policies. Sections 5.4 to 5.7 of the Jubilee Australia report goes into considerable detail on how these poor policies were induced by the PNG LNG project.

These poor policies are keeping PNG below its growth potential conservatively estimated at 5% per annum. By 2016, and probably by 2015 based on new NSO GDP figures, the non-resource sectors were doing worse than if there had been no PNG LNG project and poor associated policies. For GDP as a whole, these negative policy effects are swamping the actual boost from LNG exports by 2020.

Overall, this analysis supports the earlier conclusion from the Jubilee Australia analysis that “There were larger indirect benefits during the construction phase, and some individuals and companies have done well, but overall the economy is in a worse situation than if
there was no PNG LNG project.”

Broad Methodology (details in technical appendices below)

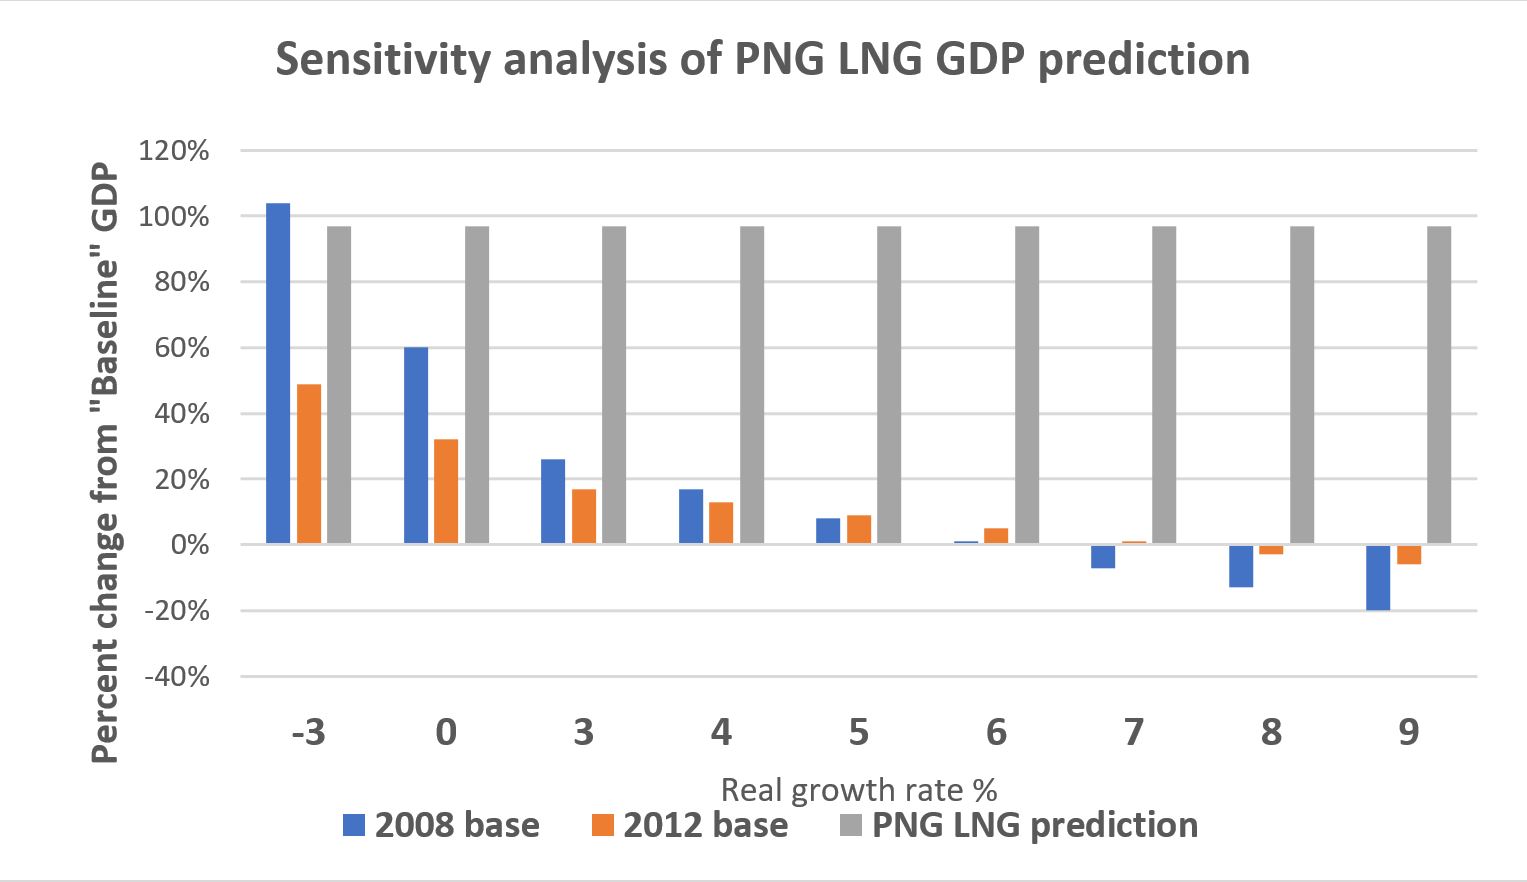
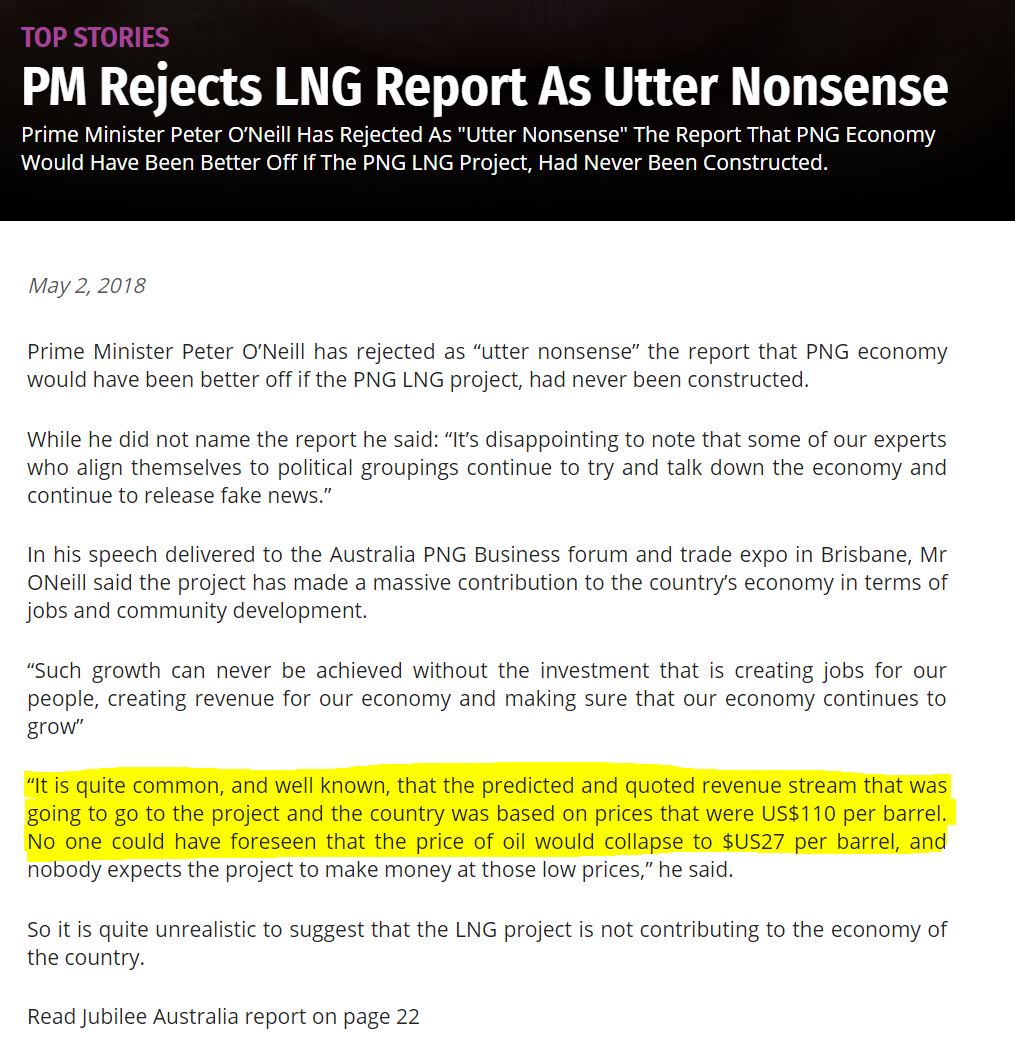
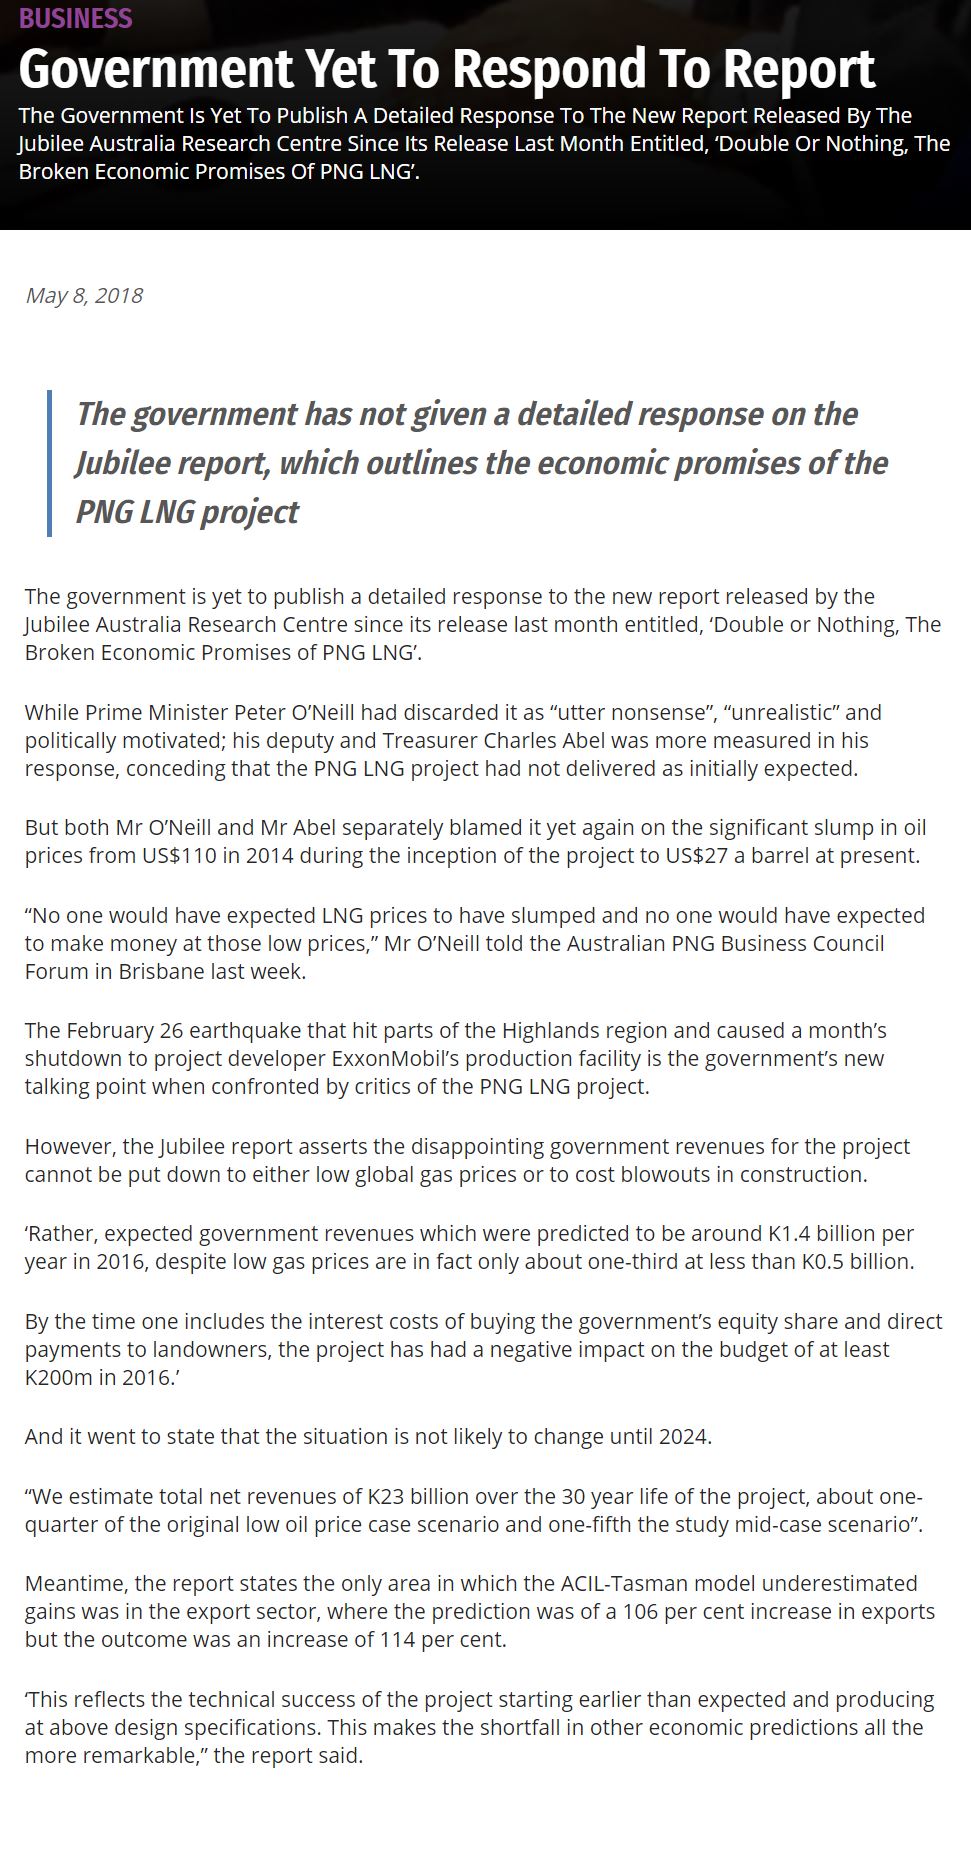
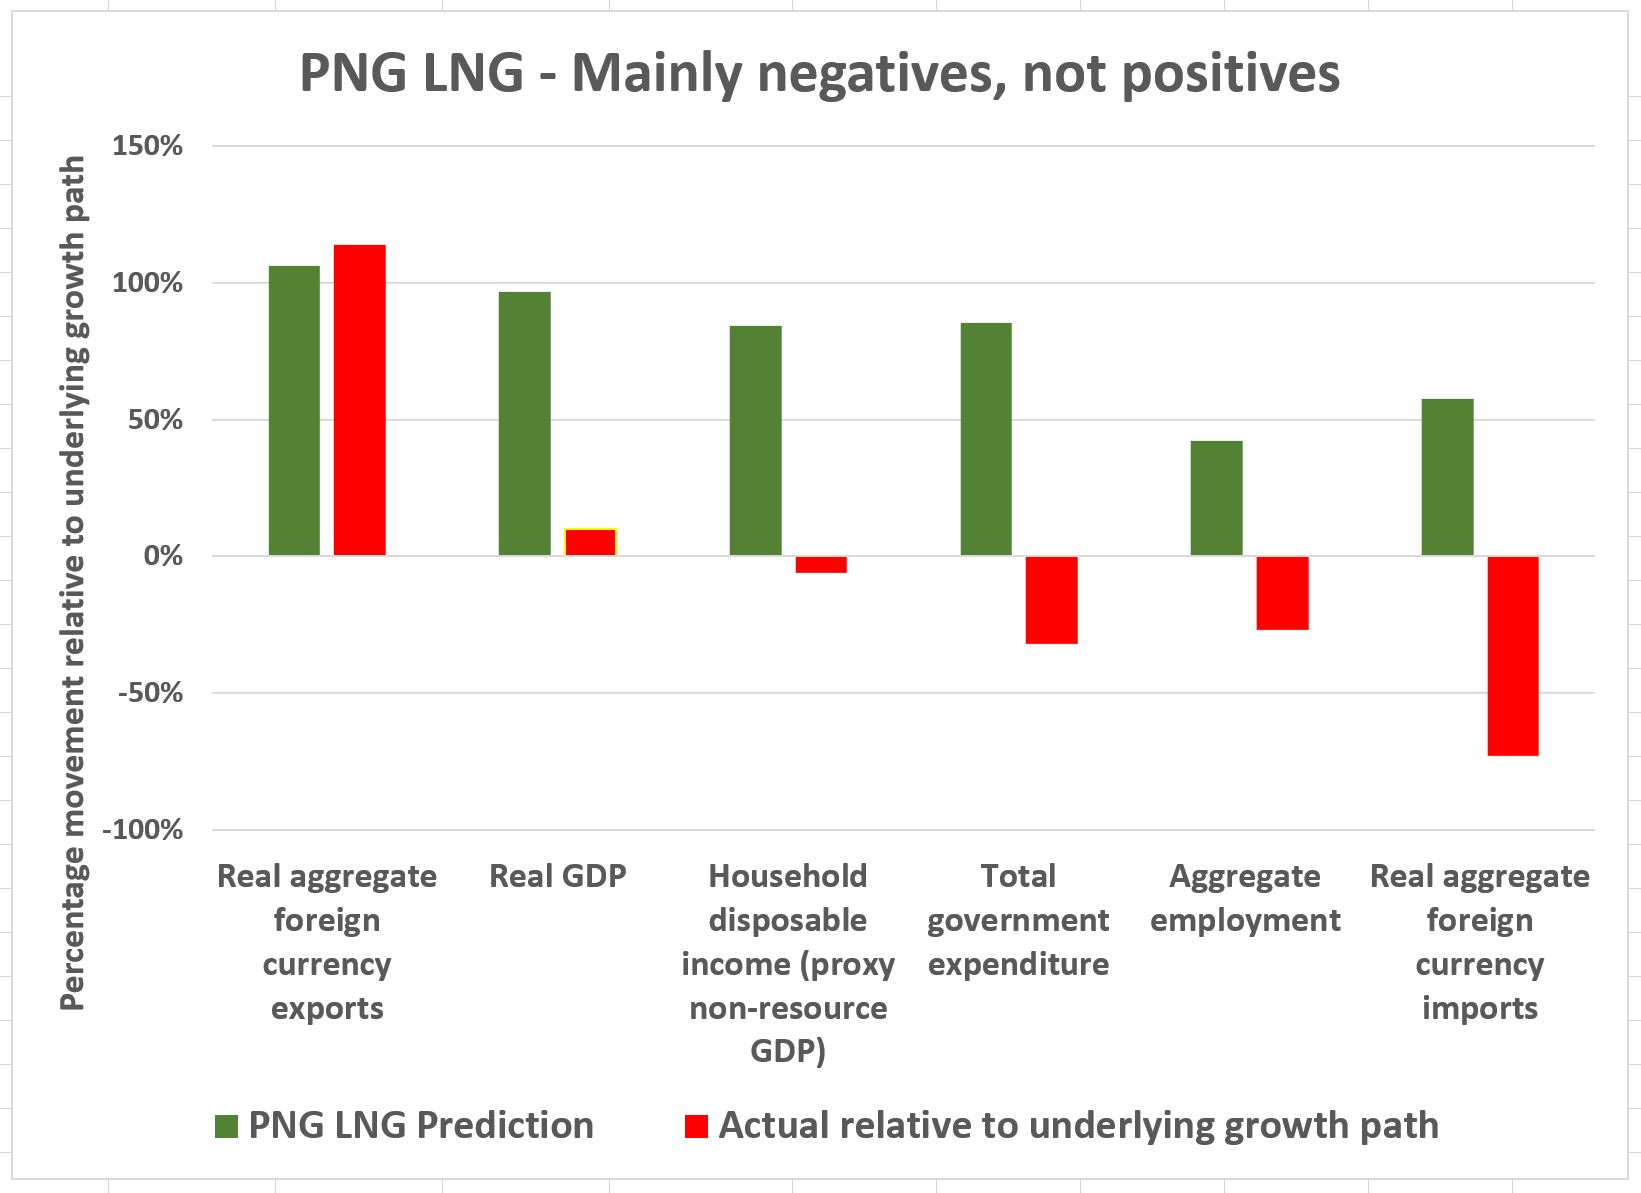
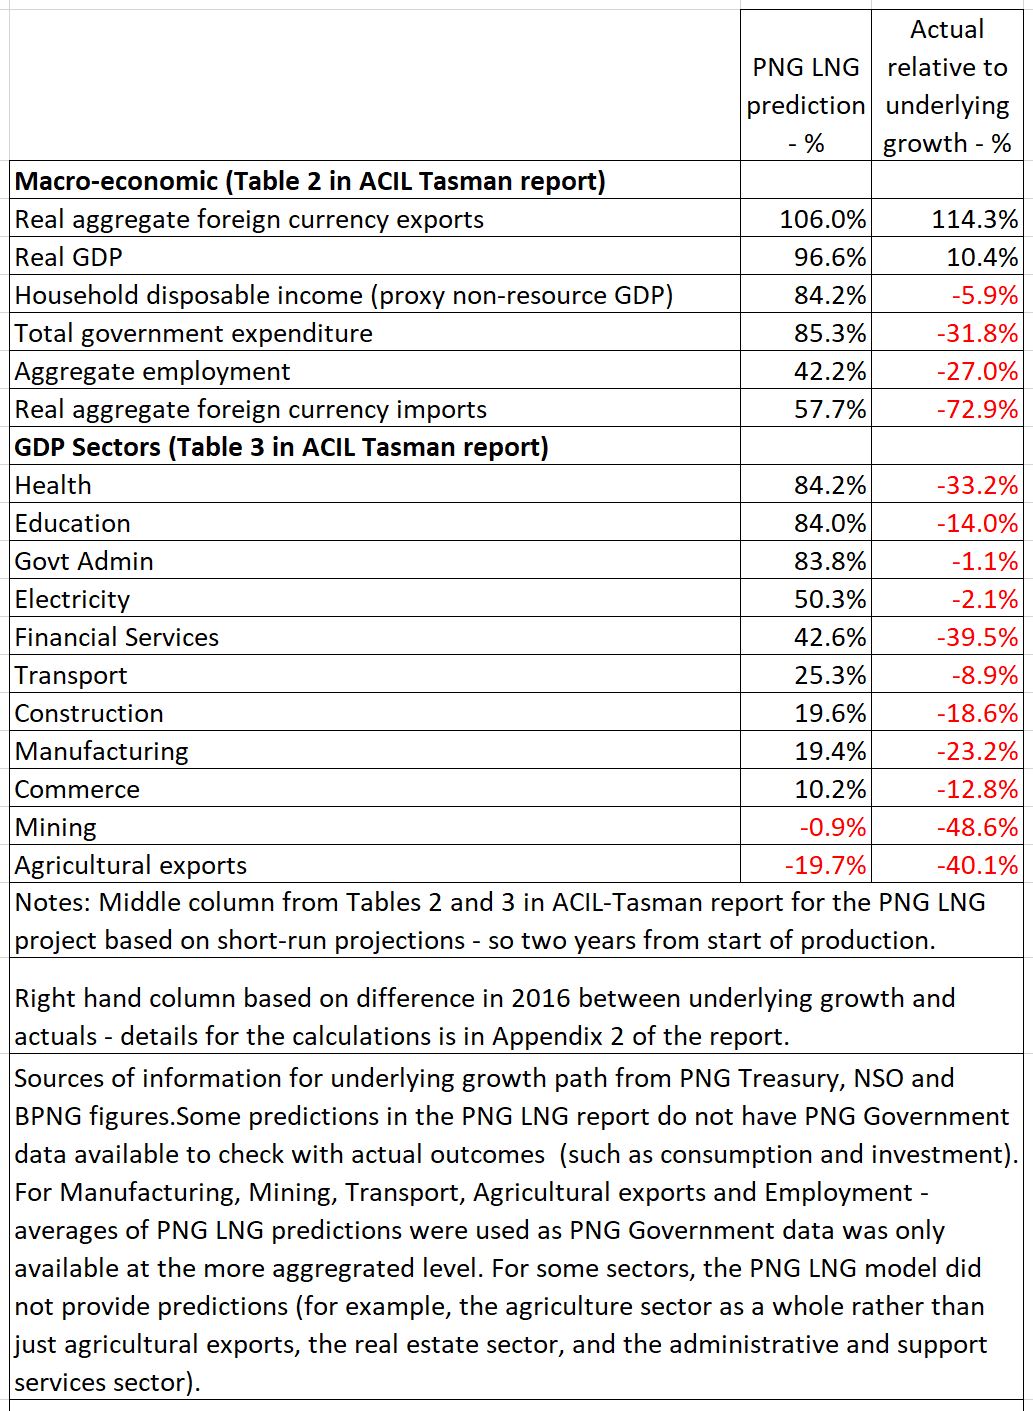
This analysis builds on an earlier analysis of the PNG LNG project by Jubilee Australia (JA) which I co-authored with Luke Fletcher – see “Double or Nothing” report here. The focus was on a 2008 ACIL-Tasman economic analysis commissioned by ExxonMobil. In particular, it examined the predictions of expected gains relative to an underlying growth path in 2016 (the short-run predictions).  These included predictions that GDP would be double the underlying growth path in 2016 – this analysis confirms the gain was actually about one-tenth that prediction – so about 10% rather than the absurd 100% predicted.

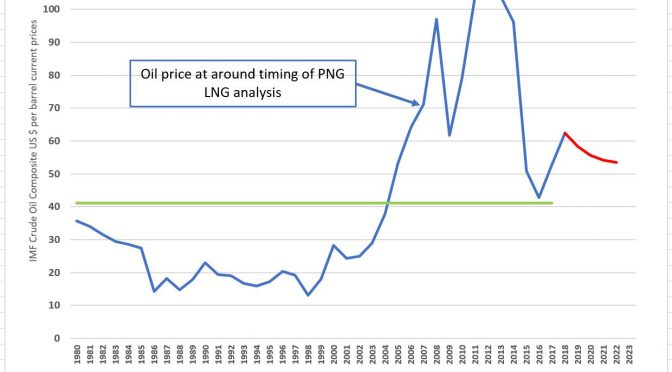
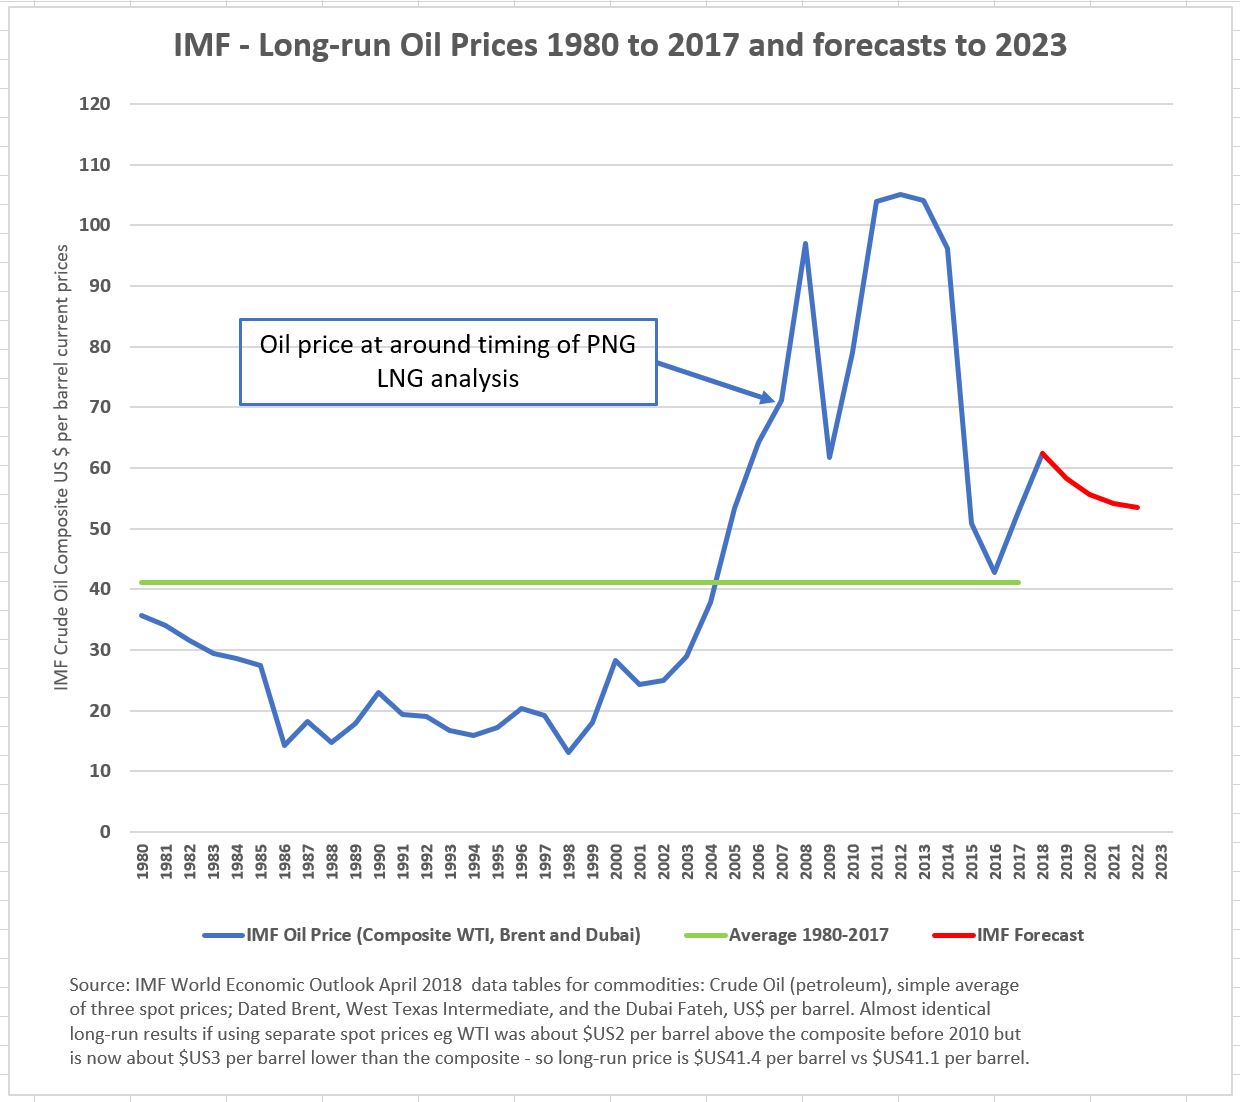
The JA report received considerable coverage – for example, it is the largest Business News story on PNG Loop in  2018. It was misunderstood by some, possibly deliberately in an attempt to discredit the analysis. There have been some subsequent clarifications (see here and here) such as the fall in oil prices does not explain the broken promises of the project, and a lack of understanding that the analysis did not deny there were some benefits for many, but the helicopter view of the whole economy indicated that there were net adverse impacts due to induced poor policies.

This analysis also includes a different but related approach. Rather than assessing the ACIL-Tasman predictions (which were outrageously optimistic and flawed), the focus is on how the PNG LNG project has affected PNG’s sectors through time, with a particular focus on 2013, and current PNG Treasury predictions for 2016 and 2021. These are compared with a reasonable underlying policy growth policy goal of 5%. The earlier ACIL-Tasman analysis was based on a model of the PNG economy that was outdated and did not directly link to current measures in the PNG National Accounts. This analysis is based on current PNG Treasury and PNG National Statistics Office views of the sectors of PNG’s economy – including details omitted in the ACIL-Tasman analysis.

In making an assessment of the impact of a major new project such as PNG LNG, there is a need to form a view on how the economy would have gone without the project. This is why the ACIL-Tasman also used an “underlying growth trend”. No economy stands still – if there were no more resource projects in prospect, the PNG government would focus on other areas to get the economy going. If a government didn’t look for other ways to get the economy growing, they would have little chance of being re-elected (unless they undermined election integrity). The focus would move to other potentials of the PNG economy – its people and its physical characteristics.  Relative to other countries, PNG actually has greater absolute advantage in areas such as cultural richness, biodiversity and soils than it has in mineral, petroleum and LNG riches.

This analysis assumes PNG has an underlying growth rate of 5%. This is in line with trends over 2007 to 2009 – immediately prior to the large ramp-up in PNG LNG construction activities (there were activities prior to this but they were small in terms of the economy). 5% is in line with PNG Treasury expectations in 2007 and 2008 based on there being no PNG LNG project (see technical appendix below).  Even with a 5% growth rate, it will take 15 years simply to get back to the real non-resource per capita level in 1980. A 5% growth rate is also the target set by PNG’s Opposition in its response to the 2018 Budget.

Following on from the Jubilee Australia analysis, this blog is an overall, “helicopter” view of impacts of the project based on economic sectors. There have clearly been a range of direct benefits from the project ranging from employment opportunities, local contracts, some revenues (although much less than expected), and provision of local community facilities including health provided by project partners such as Oil Search in the Tari hospital. At an economy-wide level, these direct benefits need to be measured also with other indirect benefits and direct and indirect costs (including those highlighted by the JA report “On Shaky Ground“).

This helicopter view examines how each sector of the economy has performed since 2008 relative to an assumed underlying growth rate trend of 5%. Differences above or below this 5% underlying growth trend provide insights into the direct and indirect impacts of the PNG LNG project. Some sectors have done well but most have not, especially as the project moved from its construction phase to its production phase.

Technical Appendix

  1. Basis for 5% growth rate

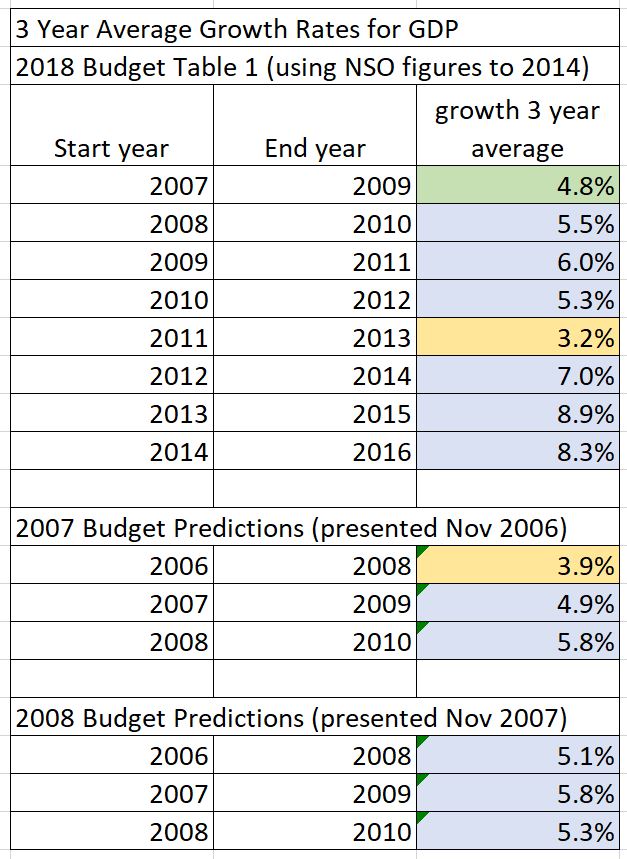
The following table examines the issue of the appropriateness of using a figure of 5% for the GDP growth rate.  The table is based on an earlier appendix in the Jubilee Australia (JA) report but was omitted for reasons of length. The JA report used a figure of 4.8% for GDP as a whole and 5.3% for non-resource GDP. These figures were derived from the average of the three year real growth rate prior to the start of the construction phase of the PNG LNG project ie 2007 to 2009.

Using  available data of all three-year weighted averages, it is only the years 2011 to 2013 which produces a real GDP growth figure lower than 5% – the other six years are higher. Indeed, over these eight time periods, the average real growth rate was 6.1%. Comparisons are also made with three year average growth rates assumed from budget estimates at the time of the PNG LNG report. Once again, only two three-year average figure are less than 5% used in this report – the other four are higher and the overall average is 5.1%.

The Governor of PNG’s central bank recently indicated that he considered PNG’s sustainable annual growth potential was 6 to 7%  – see here.  On the other hand, the most recent IMF analysis of the economy (2017 IMF Article IV) dropped the long-run potential growth estimate from 3.4% to 3.1% – presumably  reflecting what is possible on current poor policy settings.  PNG’s development plans and aspirations are based on growth rates in the 7 to 8% range (and even higher if the Vision 2050 aspirations are still in place). PNG’s Shadow Treasurer, in his response to the 2018 Budget, indicates that the PNG Opposition has an economic target of a 5% growth rate for the non-resource elements of the economy within three years of gaining office.

A 5% growth target is a key choice in analysis. Does one base growth projections on a period of good growth in the PNG economy relative to its historic averages? 5% has been achieved. Such a level is the minimum required for at least 15 years to bring PNG back to its level of economic welfare per capita in 1980.

In summary, the PNG economy was growing at around 5% in real terms during most of the 2000s. This was consistent with budget estimates at the time. It also implies a real per capita growth rate of just 2% per annum (so 5% growth less 3.1% population growth) – presumably an absolutely minimum rate to improve PNG’s prospects and a rate that has been exceeded by PNG’s Asian neighbours. Using the 5% real growth assumption is considered robust, if not conservative, and using even lower growth rates would not change the fundamental story that the PNG LNG economic analysis of impacts by ACIL-Tasman is a very, very long way from what actually happened.

2. Implications of different trend growth rates and GDP estimates

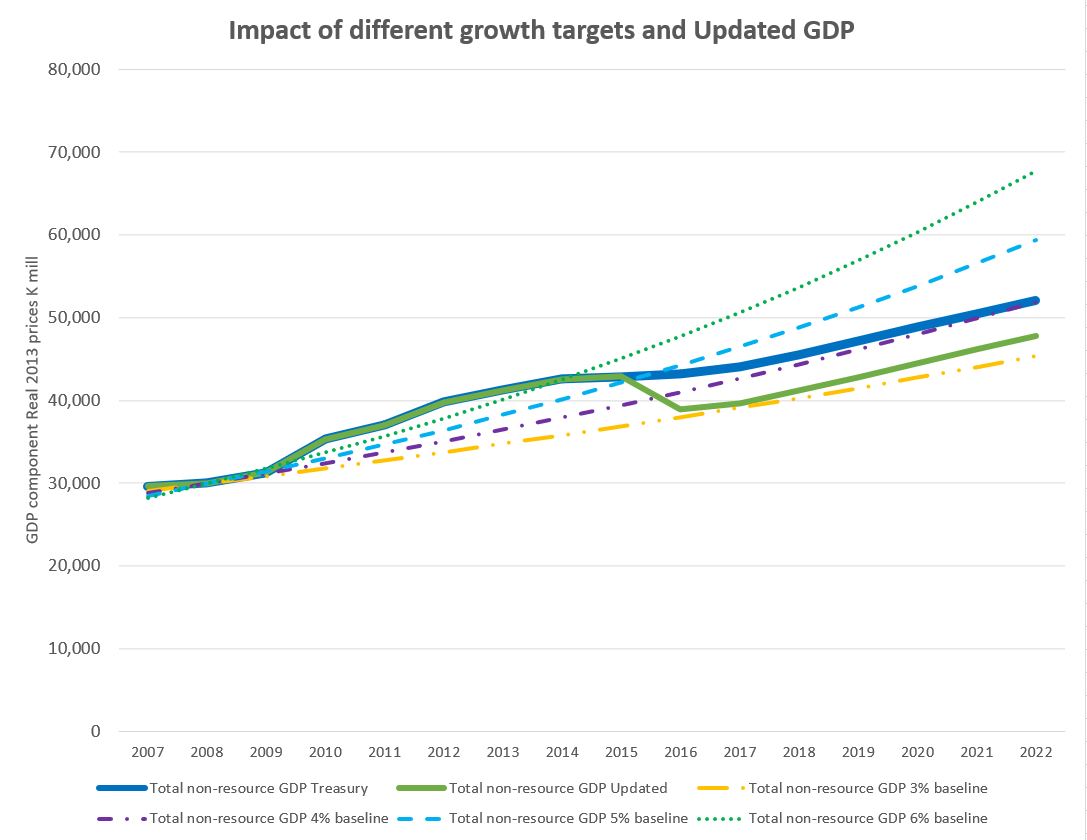
This section examines the implications of using different underlying growth rates as well as different GDP estimates.  In the following graph, four possible growth rate trends are examined – 3%, 4%, 5% and 6%. These are shown in the dotted and dashed lines.  The focus is on implications for the important non-resource elements of the economy.

As can be seen from the graph, and as expected, if the underlying growth trend is higher at 6% (the top dotted green line) then there is even a larger gap in lost opportunities. With lower trend estimates, the measured impact of the PNG LNG project and current policy settings are considered more positively.

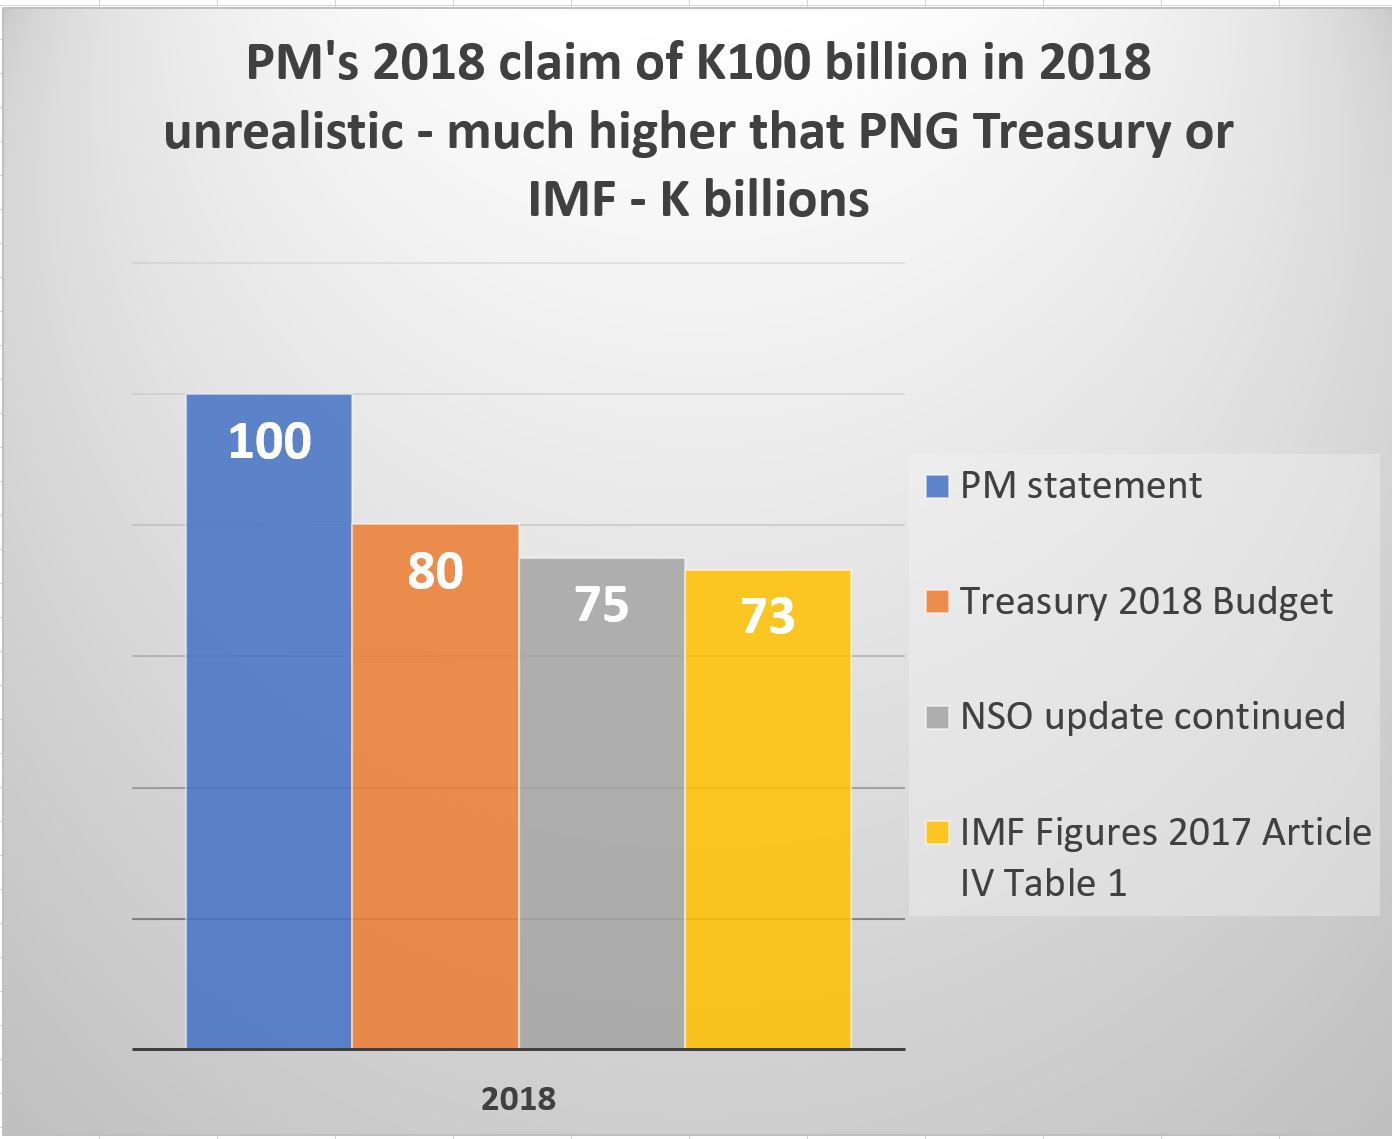
Another factor in making the above assessments is the actual size of GDP. The figures in this paper use the PNG Treasury estimates from the 2018 Budget (Table 1, Appendix 3, Volume 1). However, the NSO has indicated that the estimate for 2015 overstated nominal GDP by around 10% or K5.1 billion.  This is a massive variation, and confirms earlier suggestions that the PNG economy was actually in a recession in 2015. In addition, following a gain in 2016, recent data from BPNG indicates the economy could have slid again into a recession in 2017 based on falling employment, sales and private sector investment – although tax revenue growth and import growth suggest at least some positive growth. Putting these together, with the NSO figures built into non-resource GDP and a further K2bn reduced from the 2017 Treasury estimate, we get “updated GDP” estimates as shown by the solid green line.  In this case, the PNG economy has fallen even further behind the 5% underlying growth line, significantly below the 4% underlying growth line (purple dot dash) and only just above the 3% growth line (which is less than PNG’s population growth rate).

This analysis has applied a consistent growth trend of 5% across both the resource and non-resource components of the economy, as well as for each sector. In the JA report, each sector had its own trend growth rate based on the period 2007 to 2009 but many sectors were not covered by the ACIL-Tasman analysis – largely because information for many sectors was only released by the NSO in 2016. Using the new NSO sectoral information (which is now used by the PNG Treasury GDP estimates for the first time in the 2018 budget), the average annual sectoral growth rates from 2007 to 2009 are shown in the table below.

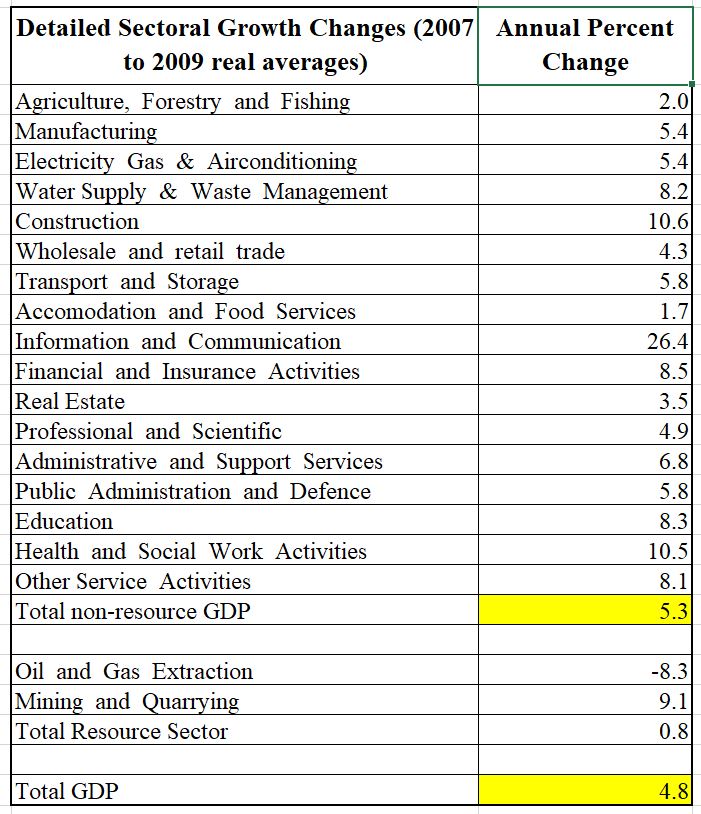
When using some of these figures, especially when projecting out for thirteen years from 2008 to 2021, it was unlikely that some sectors would continue growing so strongly. This is especially the case for the 26% real annual growth figure for the “Information and Communication” sector (a sector not covered in the ACIL-Tasman report). Doing so would imply the  sector would grow 20 times larger over the course of 13 years. The Treasury Budget figures indicate the average growth rate from 2010 to 2021 is exactly 5% per annum for this sector. The over 10% real growth per annum figure for the construction sector was also unlikely to be sustained for such a long period considered by this analysis (13 years). On the other hand, the low growth figure for the agriculture sector would hopefully have been improved upon (the ACIL-Tasman report only looked at agricultural export figures – not the national account figures for agriculture). There is also the inevitable mathematical issue that growing sectoral components at very different growth rates means that they do not add to the aggregate figure as the composition of GDP moves further away from measured actuals.  This was less of an issue when examining the ACIL-Tasman analysis as it did not cover all sectors – so there was no opportunity to examine the sectoral information with key aggregate information. Using a consistent 5% growth path does impact some of the JA analysis for particular sectors, especially those with sectoral growth rates significantly different to 5%. In particular, the construction sector is estimated to be above a 5% growth trend by a significant amount, with small gains to government, health and education services. However, the overall story that the non-resource sector has fallen below its growth potential by 2016 remains the same.

The analysis has also used 2008 as the base year, rather than using the average of the years 2007 to 2009 for simplicity. All values are in 2013 constant prices rather than 2016 prices so that it is easier to compare with the PNG Treasury figures (Table 1 Appendix 3 of the 2018 Budget Volume 1 is all in 2013 prices). The latter changes have no impacts on the earlier results.


PNG’s K100bn GDP Deceptions

PNG’s Post Courier on 4 June carried an article indicating the Prime Minister considered the PNG economy could reach K100 billion by 2018.

Hopefully, this was mis-reporting. As an accountant, one would hope that the Prime Minister of PNG would understand numbers well enough to know that there is no prospect at all of GDP reaching this figure by 2018, or even 2020. Stating otherwise would be deceptive and massively contrary to all previous official estimates from his government and the IMF. One would be reminded of the problems created for Greece with their use of fake statistics.

Official statistics

So how does this claim of K100 billion compare to other official estimates?

The PNG Treasury in its 2018 Budget statements indicated its estimate for the economy in 2018 was K80 billion (Table 1 of Appendix 3 of Statement 1).  Unfortunately, this figure was estimated before PNG’s National Statistical Office down-graded the size of PNG’s economy by K5.1 billion in 2015 (bulletin of 9 March 2018). Such a reduction is likely to flow through into future year figures also – so the PNG Treasury/NSO number is more likely to be around K75 billion in 2018.  The IMF’s estimate for 2018 is still slightly lower at K73 billion. None of these figures have included the latest very worrying economic figures from the Bank of PNG – a fall in employment, retail sales and negative growth in private sector investment which suggest a distinct possibility that PNG returned to a recession in 2017 – see here. A comparison between the various numbers is shown in the following graph:

Is the economy doing well?

The article also suggested that the Prime Minister considered such a high GDP figure indicates that the economy is doing very well. Only naysayers would be disagreeing.

Unfortunately, apart from the 2018 GDP reality being at least 20% lower than the figure quoted for the Prime Minister, economists consider issues other than just the nominal size of GDP when thinking about how an economy is going.

Nominal GDP is a very poor indicator of economic welfare, especially in a country  such as PNG where the resource sector is largely foreign owned. There is also a need to take into account changes in prices – prices are expected to increase by 56% over the decade, meaning less spending power for every Kina. Every year, there are also more mouths to feed – an additional 250,000 per year according to the NSO.

Putting these other elements together means a better way to judge how the economy has gone since, say 2010, is to look at real per capita elements of GDP as done in the following graph:

The green area is the best reflection of actual movements in living standards over the 2010s. It represents non-resource GDP, so it picks up the agriculture sector, construction, trade, utilities, services and government. Note that it is by far the largest part of the economy – averaging some 84% of the economy since Independence.  The decade started well, assisted by the construction phase of the PNG LNG project, with positive increases in non-resource GDP per capita totaling 7%. With the 2015 recession, these have quickly dropped away. Current growth projections of 3.5% in the non-resource economy, slightly above population growth rates, means that the Treasury is predicting very small improvements in the few years up to 2020.  But in recent years, PNG Treasury’s growth forecasts have been excessively optimistic – so this improvement is just a forecast.

The blue shaded area indicates the contribution from the mining sector. It has stayed fairly stable over the decade. The orange shaded area represents the impact of the PNG LNG project, especially the massive increases in 2014 and 2015. However, the benefits of this have largely gone overseas to date (there was more capture of benefits during the construction phase).

Altogether, the graph represents movements in total GPD per capita. So between 2010 and 2020, there has been an increase of 6% in total real GDP per capita – or 0.6% per year.  Not very much, and all that driven by the PNG LNG sector.  On the other hand, the real measure of economic welfare for the people of PNG has gone backwards by 5%, so negative 0.5% each year.

Conclusion

It is very positive that the Prime Minister attended the launch of a strategy for the development of statistics in PNG. PNG has suffered from a lack of good statistics. For instance, in the latest APEC regional economic report, PNG is mentioned nine times.  Unfortunately, on seven of those times, it was simply to note that PNG did not have the relevant statistics available.

One must not only collect numbers, one must understand them. Looking at PNG’s limited economic statistics over recent years are not at all encouraging. Saying there are very clearly severe problems and poor outcomes is simply being realistic – it is not being a naysayer. PNG’s two international credit ratings agencies have had a look at these available statistics and their response was an unprecedented down-grade by both within a month of PNG’s credit rating. Reported claims by the PNG Prime Minister that the economy is doing well and could reach K100 billion in 2018 simply undermines PNG’s economic credibility and damages the chances of securing an international sovereign bond.


PNG Monetary and Exchange Rate Policy update May 2018

Recent PNG Monetary Policy Developments

There has been some good, bad and confusing news from the Governor of PNG’s central bank, Loi Bakani in recent monetary policy statements (see here and here).

In summary, the good news is:

  • PNG’s central bank has committed to end its imprudent and risky practice of printing money to finance budget deficits;
  • The balance of payments has improved but there have been massive changes both up and down;
  • Possible moves towards a more flexible currency – but still a long way to go to fair value and political obstacles;
  • Inflation at 4.7% seems well under control.

The bad news is very worrying downward trends in key economic indicators:

  • A collapse in employment growth to a negative 4.8% in 2017, building on three years of negative growth – this is a sustained employment downturn and bad news for jobseekers in PNG’s already small formal employment wage sector;
  • Private sector lending collapsed by 3.4% in nominal terms (so closer to 8% after allowing for inflation) – this represents less domestic investment into businesses, houses, cars etc;
  • Foreign investment into PNG continues to decline, despite a few high profile, government-supported projects – unless PNG becomes a more attractive place for private sector investment then the possible gains of APEC will come to nought;
  • Sales figures are negative even in nominal terms – with an especially bad second half of 2017;
  • Key information continues to be hidden – where are even the 2015 National Accounts?

The “confusions” are as follows:

  • Little clarity on use of a K492.4 million cheque float in 2017 that was used to pay for government expenditure as well as much more reliance on private domestic purchases of government securities than expected;
  • New repo arrangements now require government security backing; and
  • Silence on the worst downgrade in PNG’s credit ratings in its history – possibly violating the Central Bank Act 2000.

Overall, this was a much more balanced set of monetary policy statements than we saw in 2017. There were no foolish attempts to try and defend the indefensible – such as the attempt to blame foreign exchange shortages on the banks and to claim all “printing money” actions were being fully offset (see here and here and here). In particular, the moves away from the “slack arrangement” and more flexibility on the exchange rate are very welcome, and there are some positive monetary macro-economic signs (athough still too much complacency on falling private sector credit).

However, the overwhelming message from these recent statements is that on most indicators of economic performance, 2017 has likely been a very bad year yet again for PNG. This would build on what was likely to have been a very severe recession in the non-resource sector in 2015, a likely modest recovery in 2016 post-drought, and a likely return to recession in 2017 (although tax collection figures are more promising if they can be believed – I fear they can’t). PNG needs to turn this around – and even more urgently than currently being done on the fiscal and monetary fronts. However, even if these macro-impediments are removed, PNG also needs much more concerted action on structural policy changes to improve the health, vibrancy and inclusiveness of the economy. Moves towards more protectionist policies (such as the tariff increases in the 2018 budget and targeted infant industry attempts which have failed so badly for PNG in the past) are still very worrying examples of policy positions that are strangling sustainable growth. Increased regulations in areas around foreign exchange management and foreshadowed legislation in other areas are also steps away from improving PNG’s poor ratings on creating a conducive atmosphere for business. And work is needed to try and reverse what seems like growing moves to punish anyone in government that dares suggest a contrary position – whether it be a well-respected manager in public works raising questions about road construction costs, or even a former vice-chancellor seeking greater financial accountability.

There are many parts to the complex puzzle of creating a successful state worthy of the people of PNG. The worried views of international credit ratings agencies, leading to the combined worst downgrades in PNG’s credit rating history, suggests the government still needs to be acting more urgently and on a wider front to un-do some of the damage it has done in recent years.

Details

Good news

1.       Possible end of printing money

The best news was contained in the March Monetary Policy Statement where the Governor indicated that from April the central bank was going to stop effectively printing money to finance the government’s deficit (known as the “slack arrangement”). Indeed, the central bank says it repaid K430 million in government securities in 2017 (although it did buy K51.3 million in the December 2017 quarter). This is an important development as it lowers potential inflationary risks and helps clarify that the role of the central bank is about monetary policy, not supporting government deficits. However, there are some announcements that may indicate some more back-door methods for supporting budget deficit financing (see “confusions” below).

2.       Balance of payments improvement

Another piece of good news is that there was an overall balance of payments surplus in 2017 of K350 million, up from K30 million in 2016. Within this figure were massive increases in the current account surplus (from K16 billion to K20 billion) nearly fully offset by massive increases in the capital and financial account deficit (also from K16 billion to K20 billion) – the increased surplus disappears in the rounding).

3.       Moves away from fixed exchange rate at unfair value

Another piece of good news is that there appears to be at least a very slow movement away from a de facto fixed exchange rate against the US dollar – although most of this occurred in the first few months of 2018. Of course, the move away from a freely convertible currency in PNG starting in mid-2014 has been a major reason for undermining non-resource sector growth and represents one of the poorest policy choices of BPNG in its history. Hopefully, the reform path will accelerate back to a fair exchange rate (recently estimated by ANZ as between 0.23 and 0.25 USD to Kina). However, this is not a popular move in PNG and politics may intervene – surprising as it would bring significant benefit to the vast majority of people in PNG. If a full move back to a competitive exchange rate is made, adjustment measures will be required – and these would be assisted if PNG reached out for a major structural adjustment policy package of closer to USD6 billion rather than the paltry USD0.6 billion being discussed.

4.       Inflation under control

The final piece of good news is that inflation appears to be well under control, with the headline inflation rate falling to just 4.7% in 2017. Apart from some very specific effects (such as the earlier spike in buai prices), this declining figure probably reflects the lack of demand in the economy due to poor business and household conditions.

Bad News

The worst news is that on almost all economic indicators, the non-resource parts of the economy are still really struggling. Indeed, there is growing evidence that the key non-resource sectors in PNG are probably in their most sustained recession since Independence, although probably not their deepest.

1.       Employment collapses

The drop in private sector employment in the non-mineral sector of 4.8 per cent in 2017 is catastrophic news. This would be the worst drop in employment since 2001 (a 5.5% fall) and slightly higher than the 4.6% fall in 1995. However, both of those previous examples were just bad years among years of employment growth. In PNG’s current recession, employment has dropped by 0.8% in 2014, 0.7% in 2015, 2.1% in 2016 and now 4.7% in 2017 – so an aggregate fall of 8.3% in non-resource sector private employment. Before the current recession, this employment index has never gone backwards for more than two years – although the two year drops in 1982/83 (although offset by a major increase in mineral employment) and 1990/91 were more severe.

2.       Collapse in private sector credit

Lending to the private sector also fell by 3.4% in 2017 – once again even before allowing for inflation. This means that there was a general fall in bank lending for business investment, house purchases, cars and other items. Once again, this is another indicator of a recession – more severe than the small recession of 2008 (don’t believe all that government hype about 15 years of continuous growth – the NSO says the economy went backwards slightly in 2008) and possibly larger than the late 1990s recession.

3.       Declining foreign investment

The balance of payments figures also suggest a lack of confidence in the economy by foreign investors. When explaining the large deficit in the capital and financial accounts (the increase from K16 billion to K20 billion mentioned above), the report states the “outcome was due to outflows in direct, portfolio and other investments reflecting equity outflow from liquidation of investments ….”.  PNG should be looking for major foreign investment inflows not large net outflows. Setting up the occasional dairy factory misses the point that incentives need to change to make PNG a good investment destination. If the underlying issues are not addressed, then the possible gains from APEC will disappear due to poor policies. There was a recent reference that PNG could benefit from the APEC meeting in a similar way to Peru in 2008 – but in 2008 Peru had been going through more than 15 years of structural adjustment guided by the IMF and had a much more positive set of policies to encourage broad-based growth including foreign investment and trade than PNG’s current settings. Indeed, the January 2009 IMF Article IV consultation soon after Peru hosted the APEC meeting commented that the APEC meeting had a temporary adverse impact on Peru’s growth because of the reduction in working days!

4.       Negative sales figures

Sales figures also remain negative – even in nominal terms. Across 2017, non-resource sector sales fell by 0.9% – so by over 5% in real terms after allowing for inflation of 4.7% in 2017. However, the second half of 2017 was particularly tough, with non-resource sales figures falling 7.8% in the September quarter and a further 3.0% in the December quarter. Any hope for a turnaround early in 2017 was swamped by a very tough second half.

5.       Hiding key information

Understanding the extent of PNG’s on-going recession would be clarified if National Accounts figures were released. There are preliminary figures for 2015 – and these indicated the economy was about 10% smaller in nominal terms and 5% in real terms than previously estimated by the PNG Treasury. This is a massive correction. However, the detailed figures have not been released on the performance of the non-resource economy two months after the initial release. The NSO has indicated that it will release figures up to 2017 before APEC. As long as these are not tampered with, this will be a useful building block for transparency and helping guide policy choices.

Confusions

1.       Cheque balances opaque form of deficit financing

The latest December quarter report provides some interesting additional detail on financing of the claimed 2017 budget deficit (a future blog on the FBO will argue the deficit is probably significantly larger). Specifically, the report notes domestic financing of the deficit totalled K916.6 million. This consisted of increased purchases by the private financial sector of 1,870.9 million and reduced purchasers by the central bank of K430.3 million and SOEs of 30.9 million – so a net increase in government securities of K1,409 million. So where is the gap to net domestic financing of K916 million? The answer is “presented cheque floats from the previous year was K492.4 million”. Presumably, this was a reduction in government liquid assets with the central bank. The confusion is whether the drawdown of these cheques in 2017 have been added to the measured budget deficit in 2016 as they presumably reflect expenditure in 2016? The 2017 FBO indicates that combined with the use of K180.4 million from the drawdown in cash balances of government agencies, net domestic borrowing totalled K736.2 million. However, based on BPNG figures, there has been a distinct shift towards private financial sector financing of the deficit (an additional K1,870.9 million in 2017), much greater than I expected when I read through the FBO. The uptake is somewhat surprising given frequent comments about superannuation funds and banks reaching “caps” on the level of government securities that can be held in their portfolios. This mismatch is confusing.

2.       New repo arrangements

A second interesting component of the December quarterly statement was the announcement of new conditions around short term lending between the banks and the central bank. Such trades (called repos) now need to be secured by pledging a holding of government securities as collateral. Presumably, given the role of such trades of liquidity management by banks, this will increase the private demand for government securities, and help with even further financing of the budget deficit. The value of this change is not known – although the 2016 BPNG Annual Report indicates there was little use of repos in 2016 so it may have only a very marginal impact on demand.

3.       Silence on credit ratings agency downgrades

A third confusing element of the announcement is that no comment was made about the negative news of recent credit rating agency assessments. The downgrade of the credit rating of the PNG government flowed onto a downgrade in the credit rating of BSP – PNG’s largest bank – on 30 April. This potentially moved a significant share of BPNG’s domestic investments to a higher credit risk (in 2016, K1.8 billion or half of its domestic investments had a B+ rating – presumably most of these with BSP). The implications of such a downgrade deserved a comment – they are the worst combined downgrades in PNG’s history. Under the Central Bank Act 2000, the Governor is required to provide special reports to the Treasurer on “adverse conditions that threaten the country’s monetary stability, affect monetary policy or the economic and financial policies of the government.” If the worst credit downgrades in PNG’s history do not generate a special report or general comment, it is difficult to know what would.

PNG LNG failings not because of oil price falls

The yawning chasm between PNG LNG benefit predictions and its adverse impacts on the PNG economy  (see here and here) has little to do with the fall in oil prices. Claiming so is a poor and inaccurate defence.

The PNG LNG modelling  done in 2008 accurately predicted export sales revenues for 2015 and 2016. While oil prices were some 25% below the model’s mid-case scenario, this was fully offset by actual LNG production being some 25% higher than 2008 expectations. Price falls were matched by production increases – sales revenues were as predicted. As the marginal cost of production is low (most costs of LNG production relate to the high initial capital costs), sales revenue is the driver for expected benefits.

Export sales of petroleum products increased by almost exactly the predicted 440% – from K2 billion in 2013 to K11 billion in 2016. So the failure of the PNG LNG to deliver benefits as predicated has little to do with the fall in oil prices in 2014.

Of course oil prices did fall from over $US100 per barrel in 2013 to under $US30 per barrel (for a very short time early in 2016). And of course, it would have been really nice for the PNG LNG project and government revenues if the price stayed at $US100 per barrel – although less so for PNG motorists!

However, as stated by the Chair of Oil Search at the recent AGM, there is a need for a long-term perspective on projects such as PNG LNG which operate for decades.

This long-term perspective is that oil prices from 1980 to 2017 have averaged just over $US40 per barrel – considerably lower than the 2015 to 2017 average of $US50 per barrel. This is shown in the following graph. The blue line shows the yearly movement of oil prices from the IMF’s  commodity price database. The green line shows the average oil price from 1980 to 2017. The oil price was below this level for the vast majority of this period.  Oil prices jumped upwards strongly in the 2000s, but it was always going to be risky to assume such levels would persist. Commodity cycles see prices rise and fall.

Currently, the International Monetary Fund’s international commodity price forecast is that oil prices will drop below $US60 per barrel next year (shown by the red line in the graph above). The New York Futures market has the price dropping from current prices of over $70 per barrel to under $60 per barrel by 2020.

Anyone who was planning, even if only in their own mind, for oil prices to stay around $US100 per barrel was really betting against the odds and history.  This would not be the way to plan for a country’s growth and development or how to plan for budgets. To do so would be utter nonsense.

The mid-case analysis for the PNG LNG model was $US65 per barrel. Put in a long-term perspective, while possibly understandable in the 2007 bubble before the global financial crisis, it was a somewhat optimistic mid-case perspective.  It was well above the experience of the previous decade.  The PNG LNG analysis also used other scenarios. The low-case scenario was $US36 per barrel – and the project was still economically viable at that level.

The above is written to hopefully correct a mis-understanding of the recent “Double or Nothing” report by Jubilee Australia on which I was a co-author (see here). The lack of benefits relative to predictions is not due to the fall in oil prices. Extracts indicating this confusion are included at the end of this blog. Rather, as covered in the report, there are several gaps that need explanation.

The first relates to the poor modelling of benefits which led to wildly grandiose promises. The report focused on assessing the predicted benefits to the whole economy 2 years after PNG LNG exports commenced as this was modelled by PNG LNG partners – and there was 2016 data available to test these claims.  The long-run estimated impacts (which generally were almost identical to the short-run impacts) can be re-assessed in early 2020s – until then, we can only comment on the wildly inaccurate short-run predictions.

The second and more challenging element was to try and explain the actual measured adverse impacts on the economy as a whole. This was the “helicopter” view of the PNG LNG project. Local benefits were acknowledged – the  JA report stated “There were larger indirect benefits during the construction phase, and some individuals and companies have done well, but overall the economy is in a worse situation than if there was no PNG LNG project.”

There were and are some local benefits. As indicated in a subsequent Jubilee Report “On Shaky Ground” (see here), there have also been some adverse local impacts and broken promises at the local level (both lack of infrastructure and general non-payment of royalties).

But from the perspective of the economy as a whole, PNG is now doing worse than its performance prior to PNG LNG. It has fallen below trend on most economic welfare indicators such as overall employment growth, government expenditure growth, non-resource sector growth (the best available measure for PNG household incomes) and imports. This is surprising, because the potential benefits of PNG LNG (always much lower than the grandiose predictions of project partners) would still have been expected to have small positive spin-offs for most of the rest of the economy. This did not happen.

As the report analyses (see sections 5.4 to 5.7 for detail), the most likely explanation for this is that the PNG LNG project encouraged poor policy decisions.  The impacts of these poor policy decisions are swamping any local benefits. These decisions indicate PNG has fallen yet again into a resource curse.

PNG should learn from its own history and that of other resource rich countries. Pretending the problem was a fall in oil prices is both inaccurate and misses the point that PNG needs to change its policy settings towards more inclusive development and project partners need to stop over-stating potential benefits.


Extract from Chair of Oil Search at recent AGM – see page 13 of transcript here

Extract from Prime Minister O’Neill’s response to the PNG LNG report see here 

Another indication of the oil price slump as being the cause for the lack of benefits, when PNG LNG export sales revenues are almost exactly are predicted.


Benefiting from Hindsight

The recent APNGBC meeting concluding in Brisbane this week was an interesting experience for the co-author of the “Double or Nothing – The Broken Economic Promises of PNG LNG” report that raised questions about the overall benefits of the PNG LNG projects – indeed, its potential costs.

In his keynote address to the APNGBC conference, PNG’s Prime Minister Peter O’Neill made clear he considered an analysis of the PNG LNG project as utter nonsense and being fake news.  It was surprising that the Prime Minister mentioned the report. Once mentioned, the dramatic nature of the attack was not unexpected. Unfortunately, I’d been down that road before – so a quick history of “fake news”.

In December 2014 I dared suggest that the fall in oil prices would have adverse impacts on PNG’s budget, balance of payments and economy (see the ANU Discussion Paper here). This immediately led to a media release from Prime Minister O’Neill’s office by his then Chief of Staff (now the Chief Secretary for PNG’s public service) Isaac Lupari denouncing the analysis in the following terms:

“Importantly, Ambassador Lupari said, despite claims by Polye and Flanagan, PNG is largely protected from oil price fluctuation because forward contracts were signed before the recent change in oil prices.

“Their [Flanagan’s] argument is based around the claim that PNG will receive substantially less income from LNG sales and this is simply not true,” Ambassador Lupari said.

“PNG LNG exports and prices are predominantly locked into long-term forwards sales contracts. In simple terms this means that Papua New Guinea will receive the same price for LNG.

“Mr Flanagan should know that LNG prices are locked in but he continues to play politics with business perceptions and the Opposition is going along with this nonsense.

“Polye-Flanagan appear to have no conscience when it comes to talking down the economy for their own political self-interest, and do not care of harm this could cause to small business and jobs in PNG.”’

If this analysis, contained in a thorough and peer-reviewed ANU Discussion Paper, had been listened to and considered when the analysis was made, PNG would have been in a better position to quickly respond to the emerging crisis of falling oil prices. There would have been less harm to small businesses and jobs in PNG. Of course PNG was not protected through LNG contracts and I was not working for Polye (I did as a public servant reporting to him as the then Treasurer until leaving PNG in August 2013 – so sixteen months earlier – in the same way as I did in Australia reporting to Treasurers Costello or Swan). When the PNG Treasury budget update (seven months later) confirmed the loss of revenue was even more devastating than I predicted, then I was banned from the country by the Prime Minister.

Speaking truth to power hurts. I miss seeing my friends in PNG.

Treasurer Abel’s response in welcoming the Jubilee Australia report on the same day was more measured. Presumably, he could see that the report actually strengthens the hand of PNG in its fiscal negotiations over the foreshadowed LNG project expansions – the second recommendation of the report for PNG to receive a fairer and earlier return on its LNG resources. He is also a supporter of the Extractive Industries Transparency Initiative and likely would be supportive of the third and fourth recommendations which focus on better transparency. I still consider that as Treasurer he has more work to do on the first recommendation concerning better policies – especially the foreign exchange crisis.

The Jubilee Australia report numbers will be reviewed by an accounting firm with the support of the LNG industry. PNG’s National Research Institute will also present a different and likely defensive viewpoint given the serious concerns about its model (PNGGEM) that informed the misleading ACIL-Tasman analysis. I look forward to engaging with these subsequent reports, including learning from them where appropriate.

As the coverage of the report has not focused much on the actual recommendations for the PNG government (there were also recommendations for the Australian government on Efic, improved transparency and better modelling), I include the PNG recommendations below to highlight the report aimed to present positive suggestions for PNG handling its resource wealth in a better and more balanced way:

  1. PNG should return to more inclusive development policies while better managing the resource curse. There is a need to address the overvalued exchange rate, ensure the new medium-term fiscal plans are implemented in a transparent fashion, and re-design the SWF to ensure all resource revenues flow to the budget.
  2. PNG should establish a clear policy framework for all future resource projects (and extensions) that ensures PNG gets a better and earlier share of the resource pie than current agreements. No new resource projects should be approved until this framework is completed and publicly released.
  3. Projects should not be approved without the production and release of transparent, verifiable, contestable and independent economic modelling by the government; this modelling should include a completely new independent model that includes net costs to the budget.
  4. PNG should urgently clarify some of the confusing figures in the most recent EITI reports that royalties and development levies paid by ExxonMobil are not being received, and explanations provided as to why the level of what should be identical payments are so different.

The report does not in any way deny the many direct benefits that have flowed to many from the PNG LNG project. For example, it notes that the number of jobs that have been directly created of some 2,500 is greater than the 800 to 850 initially estimated. The benefits to landowner and other companies are also acknowledged. However, the report is a helicopter view – looking at the economy as a whole rather than specific communities or companies or localities. With a starting approach of examining ACIL-Tasman predictions, the report focuses on how things were going in 2016 – two years after the production phase.  The high level, helicopter view of 2016 says that when looking at the economy as a whole, on most economic indicators, PNG has fallen below PNG’s underlying growth path from the late 2000s. The only feasible explanation for this poor performance is policies associated with PNG’s return to the resource curse, and many of these key policy shortfalls are linked to the PNG LNG project. If there was no PNG LNG project being discussed in 2008, then the government and businesses would have been looking at growing the economy in other ways – and hopefully more inclusive ways.

As the report states in its conclusion “The potential benefits of PNG’s resource wealth could in theory be able to be tapped without damaging the rest of the economy. But it would require very different choices by the PNG’s policymakers.”

As the government considers this report, there are potential benefits for PNG in terms of encouraging public discussion about PNG’s future options and even supporting PNG’s negotiating hand with the LNG companies. Hopefully, with the benefit of hindsight, “fake news” comments will fade and true benefits will be understood.

PNG LNG – Failed predictions and the resource curse

Summary

“On almost every measure of economic welfare, the PNG economy would have been better off without the PNG LNG project”.

A major study is being released today by Jubilee Australia titled: “Double or Nothing: The Broken Economic Promises of PNG LNG”. This report, co-authored by myself and Dr Luke Fletcher, compares the projected economic benefits of the PNG LNG project with actual outcomes.

The new study uses PNG Government data to examine the predictions of the 2008 project report commissioned by ExxonMobil and promoted by Oil Search. This examination finds that the very positive predictions for the PNG economy were largely incorrect. Specifically, growth in the resource sector has matched the confident predictions even with the fall in oil prices in 2014. However, all other parts of the PNG economy have not done as well as predicted. This is a major “broken promises” gap. This is the basis for the title of the latest report – the PNG LNG project promised to double GDP, but the outcome of 10% is close to nothing (especially when the size of PNG’s GDP is facing a major downgrade in the latest NSO 2015 update). Revenues to the budget are only one-third of expected levels, and after allowing for project costs, will continue having a net negative impact on the budget (so below nothing) until around 2024.

Of even greater concern, the examination finds that the PNG economy, apart from the resource sector, has actually gone backwards relative to its underlying growth path. The most likely explanation for this sad outcome is PNG has slipped again into poor policies associated with the resource curse. The temptations of the rosy PNG LNG promises were too strong for politicians despite warnings from PNG Treasury, BPNG and outside academics. During the O’Neill/Dion government, PNG descended into very damaging economic policies of a bloated budget and PNG’s largest deficits ever, fixing the exchange rate at an over-valued level, making foolish investments in areas such as Oil Search and harming the independence of PNG’s economic institutions. With the focus being so strongly on getting the PNG LNG project operational, there was a lack of policy emphasis on other parts of the economy. This is the “resource curse” gap.

PNG needs to learn the lessons from this experience. This is the third time that PNG has suffered from the resource curse: the first was with Bougainville Copper and the experience of the late 1980s; the second was the Kutubu/Porgera expectations that crashed so badly in the mid-90s; and the PNG LNG period is the third resource crisis.

The benefits of PNG’s resource wealth could in theory be tapped without damaging the rest of the economy. But it would require very different choices by PNG’s politicians. PNG probably lacks the strong governance and institutions required to deal with the powerful resource sector lobby. Even in Australia, the power of vested interests around the resource sector is blocking sensible options for sharing resource benefits more equitably and efficiently. Aggressive tax minimisation is practiced. Until PNG has stronger governance arrangements, there is a high risk that major new resource projects will simply repeat this cycle of falling into the resource curse, and damaging the rest of the economy.

Fundamentally, PNG needs a new development path – one that is more inclusive and delivers greater benefits to the people of PNG. A resource-led path is clearly failing – in terms of economic welfare, most people in PNG are one-third worse off now than in 1980. PNG’s comparative advantage is not in oil and minerals. Rather, it is the richness of its peoples’ cultural diversity, its extraordinary beauty and biodiversity, the wealth of its soils. PNG has better development options.

Details

This is the first of several blogs covering  the PNG LNG report. This blog provides some of the key numerical findings of the “Double or Nothing” report. The complete report can be accessed here – it is the third report

Future blogs will cover in more detail the current elements of PNG’s resource curse, the analysis of revenue gaps, and more technical issues not suitable for a general report, including a more detailed examination of the failed PNGGEM model and a sensitivity analysis.

Key Numerical Findings

The key macro-economic findings are covered in the following graph.

The key sectoral findings are covered in the following graph


The specific figures for the above graphs are provided in the following table:

The predictions from the ACIL-Tasman model were not specific figures such as the Kina size of GDP or the actual number of jobs generated across the entire PNG economy. If they were, they could be directly compared to actual figures from PNG government data. Rather, the ACIL-Tasman predictions from their CGE model are described as “Values expressed as percentage changes from the underlying growth path.” These are the percentages shown in the middle column of the table above. As just percentages were provided, work was required to estimate the “underlying growth path” and what value this would have been in 2016. Fortunately, this type of trend analysis is relatively simple.

Government data was used covering the late 2000s period before the PNG project commenced. Averages were taken of this data including underlying growth rates for each sector and indicator. These figures were projected forward to 2016 – the underlying growth path. These figures were then compared to 2016 actuals. This is just a simple form of trend analysis.

The gaps between the PNG LNG predictions and 2016 outcomes are generally extraordinary – there is a yawning chasm between spruiked expectations and outcomes. The only areas where there are not significant gaps are in the resource sector itself. The PNG LNG model analysis was based on the assumption of a 440% increase in the value of oil and gas exports. This was an accurate prediction and not affected by the 2014 fall in oil prices. This is because oil prices in 2008 (when the prediction was made) were also suffering from the global financial crisis and were based on oil prices of $US65 per barrel. In 2015 and 2016, although oil prices fell lower, this was offset by  production output being about 25% higher than predicted in 2008. The 440% jump in the value of these gas and oil exports led to a positive outcome for exports as a whole.

However, outside of the resource sector (which feeds into a slightly positive GDP figure growth of 10%, but 87 percentage points less than the PNG LNG prediction of a 97% gain), all other economic indicators are lower than the underlying growth path. This is shown by all the numbers in red in the right-hand column above.

On every other measure of economic welfare (household incomes, employment, government expenditure, imports and every non-resource sector of the economy), the PNG economy currently would have been better off without the PNG LNG project, often drastically so.

Details for the trend analysis to determine the underlying growth path are in Appendix 2 of the “Double or Nothing” report, with a worked example on how GDP was calculated in Section 2.2 of the report.

Shared Business Messaging – Opportunities for the APNGBC

There will be a meeting of PNG’s and Australia’s business leaders in Brisbane from 30 April to 2 May 2018 – the APNGBC.

The context for the meeting is pretty tough. PNG’s credit rating has just been down-graded by one international credit ratings agency and put on negative watch by another.  These are pretty rare events – only once a decade for an actual ratings downgrade. This is a tough backdrop for the Eurobond being suggested.

The PNG National Statistics Office recently indicated it was downgrading the estimated size of the economy in 2015 by an extraordinary 10% – from the previous questionable PNG Treasury estimates of K62 billion down to K57 billion.  This simply  confirms what businesses have known for the last several years – outside of the resource sector, PNG has faced a very serious recession.

The recent ANZ review has some very sensible suggestions on getting fairer returns from the resource sector but it also highlights the reality that PNG’s exchange rate should be some 20 to 30% more competitive than currently (the other side of a currency depreciation). This gets to the heart of the foreign exchange shortages undermining growth and investment in PNG. But talking about the need for a depreciation is not popular in PNG. Indeed, there is an unusual fracturing within the business community on this issue from the perspective of an economist. Certainly, within Australia, it is the manufacturing and agricultural industries that are strong advocates for a more competitive exchange rate – lamenting the adverse impacts  when the Australian dollar is driven higher by the minerals sector. So it is confusing when those that would gain most from such an improvement in competitiveness are opposing it? A 20% depreciation is economically identical to a 20% tariff on all imports, a 20% subsidy for all net exports, a 20% subsidy on all foreign investment and a 20% penalty on all external flows. The real losers from the lack of Kina competitiveness are the  entrepreneurs, many of them young and female, being denied  business opportunities for higher exports from PNG and higher investment into PNG.

PNG is starting to move down a more protectionist path with the suspension of the tariff reduction program and the introduction of significant new tariffs. Even as it seeks to diversify away from the resource sector, the model is one of supporting “infant industries” and direct government participation that has so poorly failed in PNG and other countries.

The 2017 Final Budget Outcome raises serious questions of credibility. The most recent BPNG Monetary Policy Statement indicates bank lending for investment and housing fell by 3% in 2017 – the first decline since 2003.

PNG is slipping back into the resource curse – the widespread characteristic that country’s with significant natural resources do worse than many other countries. PNG has been there before – certainly in the early 1990s with the Kutubu/Porgera expansion and earlier in the 1980s associated with Bougainville Copper. The PNG LNG project has pushed PNG there yet again in the context of declining governance standards. Treasurer Abel appears aware of this but it is very unclear whether he has the influence to push back on some vested interests (both political and economic). There is some welcome cyclical recovery in commodity prices but this will not deal with the underlying challenges facing PNG which are tragically impeding its growth potential.

The following three outcomes from the meeting would be positive:

  1. A continuing commitment to working together to foster the opportunities of the PNG-Australian relationship.
  2. A quiet discussion of the actual realities facing PNG’s economy – something well known to businesses and more broadly. There is a need to push back on the “groupthink” and “being part of the PNG Team” language which can cloud clear analysis of the current situation and possible solutions. The responses by the Treasurer and the Treasury Secretary to the credit downgrades are likely examples of this.
  3. A quiet strategy on how best to engage different areas of the government to ensure the development opportunities of PNG are actually realised. While acknowledging current efforts, the joint PNG/Australian business community has been more vocal in the past in encouraging sensible policies.  Possibly the business community is more divided than in the past in understanding what should be done, and doing it together. A common view on the exchange rate would be a good start.

PNG’s cash confusion – K570 million lost opportunity

PNG is reported as having a cash crisis. A leaked central bank email in late February highlighted the difficulties in having the cash to pay public servants. The response to PNG’s recent earthquake has been hampered by a lack of cash going out to relief operation centres.  Departments are being locked out of offices due to non-payment of rents.

In the context of this cash crisis, there is the extraordinary fact that the PNG government turned down K300 million in cash offered to it by the private sector on 7 March. It then turned down K270 million on 14 March. These amounts were the level of funds offered through the weekly Treasury Bill auction less the amount actually accepted by the Government.

This K570 million level of excess funding (or over-subscriptions) by PNG’s banks, financial institutions and superannuation is unprecedented. It represented an opportunity to collect some scarce cash to pay down bills and help meet the needs of the PNG’s disastrous earthquake.

This opportunity possibly has been squandered. Someone should be held accountable for such decisions – probably the Secretary of the Treasury, and if he informed the Treasurer, then the Treasurer himself.

And what will the government do on 21 March if the opportunity is offered again?

Details

A normal part of government is managing cash flows.  Tax receipts can come in at times different to when bills have to be paid. Indeed, in PNG, with company tax coming in relatively late in the year, and the desirability of paying some bills towards the start of the year (such as payments to schools and to provinces) there is a need to raise some extra cash earlier in the year. In addition, the O’Neill government has been running the largest deficits in PNG’s history, and these have been primarily financed by short-term domestic debt raised through the weekly Treasury Bill auctions. Over recent years, the share of this short-term debt has increased from 19% of reported public debt in 2011 to 39% in 2017 and now totals at least K9.4 billion based on 2018 Budget figures (of course, there are large debts that are being hidden off-budget). The problem of short-term debt is that the government has to roll it over regularly depending on the term (usually between 3 and 12 months). Combining these three elements (differences between revenues and expenditure, financing the deficit, and rolling over debt from previous deficits) while keeping interest lows and avoiding too much bunching of previous debt becoming due is the standard challenge of cash management.

In PNG, there is a weekly meeting of the Public Debt Committee to determine cash funding needs. This PDC includes key government agencies such as Treasury, Finance, the Internal Revenue Commission and the Bank of PNG. Each week, they determine how much should aim to be raised during the weekly auction managed by BPNG. The following graph indicates the level of these cash requests (or government offers of Treasury Bill securities) from weekly auctions over the last 15 months.

(Source: BPNG website on Treasury Bill auction results as well as Kina Securities Weekly Investor Updates – data is missing 7 data points out of 62 possibilities due to non-reporting of information)

On average, the weekly auction has aimed to raise K225 million Kina. The actual weekly amounts requested vary considerably, from slightly under K100m to over K350m. These offers are made to PNG’s major financial institutions (there is a very small investor market but this operates at only around K1 million per auction). On 60% of occasions, PNG’s financial institution do not offer as much cash as the government through the PDC is requesting.  This is called an under-subscription. The average under-subscription over the last 15 months has been K59m. On 40% of occasions, PNG’s financial institutions offer more than is requested. On average, this has been K55 million. Sometimes this over-subscription is taken up, depending on the interest rates being requested from the private sector.

However, something extraordinary happened over the last two weekly auctions. The level of over-subscriptions has jumped dramatically.  The details of the latest weekly auction result is copied below as an example:

The government sought funding for a mix of 182 day (six month), 272 day and 364 day  (one year) Treasury Bills totalling just under K300m. The private sector offered K535m, a massive level of over-subscription. Then two things happened. First, the government rejected this K235m extra cash that was being offered by the private sector. Second, the government dropped the level of funds it was raising down to K265m, so effectively rejecting a further K35m that was being offered. A similar things happened at the 7 March auction – K357m was initially sought, the private sector offered K587m ( an over-subscription of K230m), but the government dropped the level of funds being raised down to K287m, thereby effectively rejecting another K70m that was being offered. The extra-ordinary nature of these over-subscriptions is shown in the following graph.

This was an amazing opportunity to help meet some of the backlog in legitimate bills that the PNG government owes as well as meeting the needs of earthquake victims. Possibly, if the first K300m was taken up, there may have been less available the next week but that is unknown. The reasons for the rejection may because of a refusal to allow average interest costs to increase at all, and a fear of future bunching, but these are very difficult judgement calls given the cash needs within PNG. Surely a better decision would have been to accept the cash even if this pushed interest rates up slightly and any bunching issue was handled with forward planning.

Conclusion

My view until March 2018 was that the O’Neill government was facing a major cash crisis. This was caused by poor fiscal policy with a continuation of the worst deficits in PNG’s history. His way out had been a compliant central bank governor that was generally willing to print money (through the ‘slack arrangement’). This was a very dangerous course for PNG.

Then the last two Treasury Bill auction results indicate that the private sector was offering a partial way out of PNG’s cash crisis without printing money. For reasons that should be provided, the O’Neill government decided to not accept up to K570m in extra cash financing. Of course this cash should not be used just to finance some further “big man” projects or funneled into questionable and corrupt contracts. However, there are some very legitimate cash financing requirements that could have been met – including providing a better response to the earthquake. The big questions are whether anyone will be held accountable, and if the opportunity arises at the Treasury Bill auction on 21 March, what will the government do?

PNG IMF Article IV – Profligate 2018 Budget fails IMF expectations

Summary

The 2017 Supplementary Budget was a good start for PNG’s O’Neill/Abel government, but it then stumbled badly. Politics and presentational games have overtaken good economic policy.

The PNG Government has gone on an unsustainable spending binge in 2018 – expenditure is K2 billion higher, or 16 per cent, than the IMF was hoping.

The fiscal implications of this unsustainable spike in expenditure is hidden through misleading revenue games. The 2018 Budget assumes revenues K1.5 billion higher than the IMF’s optimistic scenario.

The IMF estimates PNG will break the 35% limit on the debt to GDP ratio, both because it has a lower baseline for revenue estimates and because it has much lower GDP estimates.

The IMF also estimates that the deficit to GDP ratio will exceed 3%. Looking at the experience of the 2016 budget, including on-going revelations about payment arrears, the risk is that the deficit will end up being closer to 5% of GDP.

Details

The IMF released its annual review of the PNG economy in late December – see here. In an earlier article, I covered some of the economic implications of the analysis – primarily that the IMF estimated PNG’s GDP would be some 10% lower in 2018 than forecast by the government. This article focuses on the budget elements of the annual Article IV review by a relatively independent economic commentator.

The IMF Article IV review of PNG was broadly positive of the 2017 Supplementary Budget. Indeed, it noted the Supplementary Budget contained “bold measures to ensure a narrowing of the fiscal deficit.” However, it immediately went on to say “Nonetheless, on unchanged fiscal and monetary policies, PNG faces several more years of economic stagnation with a growing risk of fiscal and financial instability as the debt-to-GDP ratio continues to rise and financing of deficits becomes increasingly difficult.” (IMF Press Release 17/523 3rd para).

So what were the “unchanged fiscal” policies that the IMF feared, and what alternative path was the IMF suggesting?

The IMF’s report was completed on 17 November 2017, 11 days before the release of the 2018 Budget  So the IMF had no opportunity to comment directly on the 2018 Budget. However, the IMF did set out what it regarded as a “passive” scenario which would continue economic stagnation – this is the business as usual case. The IMF also set out a more optimistic or “active” scenario of better fiscal settings.

This post analyses the 2018 budget relative to these two scenarios included in the IMF report. The IMF’s analysis was based on shares of GDP. The following table converts these percentages into actual Kina billions (by simply multiplying the percentages with GDP) to allow a comparison with the 2018 budget.

IMF relative to PNG 2018 Budget figures (Kina billions)

2017 2018 2019 2020
Passive IMF Revenue 10.5 10.9 11.4 12.0
Active IMF Revenue 10.5 11.2 12.5 14.0
PNG Government Revenue 11.0 12.7 12.6 13.6
2017 2018 2019 2020
Passive IMF Expenditure 12.8 13.2 14.1 14.8
Active IMF Expenditure 12.8 12.7 13.4 14.2
PNG Government Expenditure 12.9 14.7 14.5 15.2
[Source:  Text Table 1 on page 12 of the report. IMF GDP figures drawn directly from the Article IV report for the “business as usual” passive case. For the “active” case, these nominal GDP figures are adjusted upwards slightly as the IMF estimates  in Text Table 1 that nominal GDP will be slightly larger as the higher inflationary impacts will be larger than the smaller real growth impacts -so net increases in nominal GDP of 1.4% in 2018, another 2.6% in 2019 and another 2.7% in 2020.]


The key conclusion is that the IMF 2018 Budget’s expenditure is an extraordinary 16% – or K2 billion -greater than the IMF was hoping for. Indeed, 2018 expenditure is 12% – or K1.5 billion – greater than the assumed “business as usual” scenario. Clearly, the IMF did not expect the blow-out in government expenditure that occurred in the 2018 budget. If it had done so, one would have expected much sterner warnings about the actual fiscal risks now facing PNG.

Equally extraordinarily, budget revenue forecasts were much, much greater than expected by the IMF. The PNG government is expecting 1.5 billion Kina in extra revenues even beyond the IMF’s most optimistic “active” policy scenario. This is the case even after allowing for K0.6 billion in once-off “sweep” revenue – mainly from the National Fisheries Authority. Given the amount of assistance the IMF has given in the areas of revenue forecasting and the new medium-term revenue strategy – so they would have had excellent access to the latest information and modelling from the PNG Treasury – the gap of K1.5 billion is very concerning for 2018 budget credibility.

The very unusual nature of the PNG government estimates for 2018 are shown in the following graphs. One would usually expect a steady increase in both revenue and expenditure, not sudden bumps unless there were clear reasons for their being so.  It is extremely hard to understand the massive revenue spike upwards in 2018 and then a fall in nominal terms in 2019. This is also the case for expenditure. There are once off costs for APEC, but these are shown  in the budget as totalling only K0.3 billion, slightly up from 2017 (clearly an unrealistically low estimate based on previous APEC’s and earlier IMF estimates). Expenditure and revenues have very suspicious spikes in 2018. They were not expected by the IMF under either of its scenarios. And the drop back to more realistic figures from 2019 suggest there is something very fishy, indeed something potentially fraudulent, in the 2018 budget numbers.


Medium-Term Revenue Plan

A positive of the budget is that it recognised the dramatic fall in revenues in recent years and set out a medium-term revenue plan to address these issues. As noted in the new strategy, revenues (excluding donor grants) have fallen from around 20% of GDP from 2012-14 down to below 13% of GDP in 2017.

However, it is interesting that by 2020, the planned revenues are below the levels that the IMF considers possible under an active policy strategy (see LHS of chart above). Indeed, a revenue to GDP target of 14% appears too low given PNG’s development challenges. The revenue plan also is not explicit enough that the level of taxes on the resource sector should be increased. Economic theory suggests that the average tax rate in the resource sector should be higher than the non-resource sector, so a target tax ratio closer to 30% for the resource sector would seem appropriate (which is close to its average levels in the 1990s and 2000s). In addition, although it is positive that a revenue crisis has been acknowledged, the O’Neill/Abel government has not acknowledged the underlying issue of poor economic performance – see here.

One positive element of the plan is that the revenue forecasts from Treasury now form the basis for the new Medium-Term Development Strategy. This will remove the tendency for National Planning to use questionable models that generate unrealistic expectations about likely revenue flows which in turn opened an unmanageable gap between annual budgets and medium-term expenditure planning.

A particularly negative element of the plan is the foolish decision to “increase tariff rates to assist adjustments in the manufacturing sector”. This is protectionist fiction and simply indicates the increased power of the manufacturing sector relative to consumers and the overall health of the economy. PNG is not focusing on its areas of comparative advantage needed for sustainable development.

Conclusion

The IMF Article IV report was complimentary about Treasurer Charles Abel’s first budget – the 2017 Supplementary Budget. It had hopes for an active fiscal policy continuing into the 2018 Budget. They would have been sorely disappointed.

The extraordinary blow-out in expenditure, backed by very unrealistic revenue expectations for 2018, severely damages the credibility of the new Treasurer. The politics of protecting constituency funding, the need to be seen to at least reverse the massive cuts in infrastructure, health and education in recent years, as well as the high costs of hosting APEC, contributed to this unexpected blow-out in expenditure.

The sacrificial lamb in this political budget process was revenue credibility. As PNG’s shadow Treasurer Mr Ling-Stuckey has pointed out, the revenue estimates seem significantly inflated in terms of compliance cost returns, dividends and GST revenues – see relevant parts of budget reply speech here.

The 2018 budget figures are very similar to the 2016 budget – K12.7 billion in revenue and K14.8 billion in expenditure. Actual revenues in 2016 ended up being K10.5 billion – an extraordinary shortfall of K2.2 billion – see here. There is a fear that this experience is about to be repeated with probably around K2 billion in unrealistic revenues as even higher oil prices will take considerable time to flow into higher revenues. Large revenue shortfalls means large expenditure cuts and even more difficulties financing the deficit. With O’Neill and his advisors dominating government economic policy once again, no lessons appear to have been learnt. The people of PNG will be the ones that will eventually pay the price.